Sprint - Nextel 2012 Annual Report Download - page 165
Download and view the complete annual report
Please find page 165 of the 2012 Sprint - Nextel annual report below. You can navigate through the pages in the report by either clicking on the pages listed below, or by using the keyword search tool below to find specific information within the annual report.-
 1
1 -
2
-
3
-
4
-
5
-
6
-
7
-
8
-
9
-
10
-
11
-
12
-
13
-
14
-
15
-
16
-
17
-
18
-
19
-
20
-
21
-
22
-
23
-
24
-
25
-
26
-
27
-
28
-
29
-
30
-
31
-
32
-
33
-
34
-
35
-
36
-
37
-
38
-
39
-
40
-
41
-
42
-
43
-
44
-
45
-
46
-
47
-
48
-
49
-
50
-
51
-
52
-
53
-
54
-
55
-
56
-
57
-
58
-
59
-
60
-
61
-
62
-
63
-
64
-
65
-
66
-
67
-
68
-
69
-
70
-
71
-
72
-
73
-
74
-
75
-
76
-
77
-
78
-
79
-
80
-
81
-
82
-
83
-
84
-
85
-
86
-
87
-
88
-
89
-
90
-
91
-
92
-
93
-
94
-
95
-
96
-
97
-
98
-
99
-
100
-
101
-
102
-
103
-
104
-
105
-
106
-
107
-
108
-
109
-
110
-
111
-
112
-
113
-
114
-
115
-
116
-
117
-
118
-
119
-
120
-
121
-
122
-
123
-
124
-
125
-
126
-
127
-
128
-
129
-
130
-
131
-
132
-
133
-
134
-
135
-
136
-
137
-
138
-
139
-
140
-
141
-
142
-
143
-
144
-
145
-
146
-
147
-
148
-
149
-
150
-
151
-
152
-
153
-
154
-
 155
155 -
 156
156 -
 157
157 -
 158
158 -
 159
159 -
 160
160 -
 161
161 -
 162
162 -
 163
163 -
 164
164 -
 165
165 -
 166
166 -
 167
167 -
 168
168 -
 169
169 -
 170
170 -
 171
171 -
 172
172 -
 173
173 -
 174
174 -
 175
175 -
176
-
177
-
178
-
179
-
180
-
181
-
182
-
183
-
184
-
185
-
186
-
187
-
188
-
189
-
190
-
191
-
192
-
193
-
194
-
195
-
196
-
197
-
198
-
199
-
200
-
201
-
202
-
203
-
204
-
205
-
206
-
207
-
208
-
209
-
210
-
211
-
212
-
213
-
214
-
215
-
216
-
217
-
218
-
219
-
220
-
221
-
222
-
223
-
224
-
225
-
226
-
227
-
228
-
229
-
230
-
231
-
232
-
233
-
234
-
235
-
236
-
237
-
238
-
239
-
240
-
241
-
242
-
243
-
244
-
245
-
246
-
247
-
248
-
249
-
250
-
251
-
252
-
253
-
254
-
255
-
256
-
257
-
258
-
259
-
260
-
261
-
262
-
263
-
264
-
265
-
266
-
267
-
268
-
269
-
270
-
271
-
272
-
273
-
274
-
275
-
276
-
277
-
278
-
279
-
280
-
281
-
282
-
283
-
284
-
285
-
286
-
287
 |
 |

Table of Contents
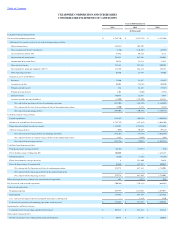
CLEARWIRE CORPORATION AND SUBSIDIARIES
CONSOLIDATED STATEMENTS OF CASH FLOWS
Year ended December 31,
2012
2011
2010
(In thousands)
Cash flows from operating activities:
Net loss from continuing operations
$
(1,743,745
)
$
(2,855,733
)
$
(2,251,202
)
Adjustments to reconcile net loss to net cash used in operating activities:
Deferred income taxes
(199,199
)
105,308
—
Non-cash gain on derivative instruments
(1,356
)
(145,308
)
(63,255
)
Accretion of discount on debt
41,386
40,216
6,113
Depreciation and amortization
768,193
687,636
454,003
Amortization of spectrum leases
54,328
53,674
57,433
Non-cash rent expense
197,169
342,962
200,901
Loss on property, plant and equipment (Note 5)
171,780
966,441
345,727
Other operating activities
42,740
27,745
49,506
Changes in assets and liabilities:
Inventory
11,200
15,697
(11,697
)
Accounts receivable
50,401
(54,212
)
(20,550
)
Prepaids and other assets
326
22,447
(73,767
)
Prepaid spectrum licenses
1,904
(4,360
)
(3,294
)
Deferred revenue
170,455
16,497
8,447
Accounts payable and other liabilities
(17,090
)
(152,180
)
136,233
Net cash used in operating activities of continuing operations
(451,508
)
(933,170
)
(1,165,402
)
Net cash provided by (used in) operating activities of discontinued operations
(3,000
)
2,381
(3,311
)
Net cash used in operating activities
(454,508
)
(930,789
)
(1,168,713
)
Cash flows from investing activities:
Capital expenditures
(112,997
)
(405,655
)
(2,646,365
)
Purchases of available-
for
-sale investments
(1,797,787
)
(957,883
)
(2,098,705
)
Disposition of available-
for
-sale investments
1,339,078
1,255,176
3,776,805
Other investing activities
(655
)
20,229
(44,119
)
Net cash used in investing activities of continuing operations
(572,361
)
(88,133
)
(1,012,384
)
Net cash provided by (used in) investing activities of discontinued operations
1,185
(3,886
)
(834
)
Net cash used in investing activities
(571,176
)
(92,019
)
(1,013,218
)
Cash flows from financing activities:
Principal payments on long-term debt
(26,985
)
(29,957
)
(876
)
Proceeds from issuance of long-term debt
300,000
—
1,413,319
Debt financing fees
(6,205
)
(1,159
)
(53,285
)
Equity investment by strategic investors
8
331,400
54,828
Proceeds from issuance of common stock
58,460
387,279
304,015
Net cash provided by financing activities of continuing operations
325,278
687,563
1,718,001
Net cash provided by financing activities of discontinued operations
—
—
—
Net cash provided by financing activities
325,278
687,563
1,718,001
Effect of foreign currency exchange rates on cash and cash equivalents
107
(4,573
)
(525
)
Net decrease in cash and cash equivalents
(700,299
)
(339,818
)
(464,455
)
Cash and cash equivalents:
Beginning of period
893,744
1,233,562
1,698,017
End of period
193,445
893,744
1,233,562
Less: cash and cash equivalents of discontinued operations at end of period
—
1,815
3,320
Cash and cash equivalents of continuing operations at end of period
$
193,445
$
891,929
$
1,230,242
Supplemental cash flow disclosures:
Cash paid for interest including capitalized interest paid
$
505,913
$
474,849
$
336,314
Non-cash investing activities:
Fixed asset purchases in accounts payable and accrued expenses
$
20,795
$
14,144
$
120,025