Sprint - Nextel 2012 Annual Report Download - page 39
Download and view the complete annual report
Please find page 39 of the 2012 Sprint - Nextel annual report below. You can navigate through the pages in the report by either clicking on the pages listed below, or by using the keyword search tool below to find specific information within the annual report.-
 1
1 -
2
-
3
-
4
-
5
-
6
-
7
-
8
-
9
-
10
-
11
-
12
-
13
-
14
-
15
-
16
-
17
-
18
-
19
-
20
-
21
-
22
-
23
-
24
-
25
-
26
-
27
-
28
-
 29
29 -
 30
30 -
 31
31 -
 32
32 -
 33
33 -
 34
34 -
 35
35 -
 36
36 -
 37
37 -
 38
38 -
 39
39 -
 40
40 -
 41
41 -
 42
42 -
 43
43 -
 44
44 -
 45
45 -
 46
46 -
 47
47 -
 48
48 -
 49
49 -
50
-
51
-
52
-
53
-
54
-
55
-
56
-
57
-
58
-
59
-
60
-
61
-
62
-
63
-
64
-
65
-
66
-
67
-
68
-
69
-
70
-
71
-
72
-
73
-
74
-
75
-
76
-
77
-
78
-
79
-
80
-
81
-
82
-
83
-
84
-
85
-
86
-
87
-
88
-
89
-
90
-
91
-
92
-
93
-
94
-
95
-
96
-
97
-
98
-
99
-
100
-
101
-
102
-
103
-
104
-
105
-
106
-
107
-
108
-
109
-
110
-
111
-
112
-
113
-
114
-
115
-
116
-
117
-
118
-
119
-
120
-
121
-
122
-
123
-
124
-
125
-
126
-
127
-
128
-
129
-
130
-
131
-
132
-
133
-
134
-
135
-
136
-
137
-
138
-
139
-
140
-
141
-
142
-
143
-
144
-
145
-
146
-
147
-
148
-
149
-
150
-
151
-
152
-
153
-
154
-
155
-
156
-
157
-
158
-
159
-
160
-
161
-
162
-
163
-
164
-
165
-
166
-
167
-
168
-
169
-
170
-
171
-
172
-
173
-
174
-
175
-
176
-
177
-
178
-
179
-
180
-
181
-
182
-
183
-
184
-
185
-
186
-
187
-
188
-
189
-
190
-
191
-
192
-
193
-
194
-
195
-
196
-
197
-
198
-
199
-
200
-
201
-
202
-
203
-
204
-
205
-
206
-
207
-
208
-
209
-
210
-
211
-
212
-
213
-
214
-
215
-
216
-
217
-
218
-
219
-
220
-
221
-
222
-
223
-
224
-
225
-
226
-
227
-
228
-
229
-
230
-
231
-
232
-
233
-
234
-
235
-
236
-
237
-
238
-
239
-
240
-
241
-
242
-
243
-
244
-
245
-
246
-
247
-
248
-
249
-
250
-
251
-
252
-
253
-
254
-
255
-
256
-
257
-
258
-
259
-
260
-
261
-
262
-
263
-
264
-
265
-
266
-
267
-
268
-
269
-
270
-
271
-
272
-
273
-
274
-
275
-
276
-
277
-
278
-
279
-
280
-
281
-
282
-
283
-
284
-
285
-
286
-
287
 |
 |

Table of Contents
resulted in lease exit costs totaling approximately
$196 million
as of
December 31, 2012
. We expect to complete our shutdown of the Nextel platform on
June 30, 2013. As a result, we expect to incur significant additional charges in the future under other tower lease agreements as we continue to take off
-
air Nextel platform sites as well as transition our existing backhaul architecture to a replacement technology for our remaining network sites.
We are also experiencing increased data usage driven by more subscribers on the Sprint platform and a continuing shift in our subscriber
base to smartphones, which has required additional capital expenditures of legacy 3G Sprint platform equipment (legacy equipment). As we deploy
Network Vision, we intend to maximize the use of previously deployed legacy equipment when possible; however, based on our capacity needs during
the implementation period of Network Vision, we expect additional legacy equipment expenditures that will not be utilized beyond the final deployment
of Network Vision's multi
-
mode technology, which is expected to continue through the middle of 2014. As a result, the estimated useful lives of such
equipment have been shortened, as compared to similar prior capital expenditures, which we also expect will contribute to an increase in depreciation
expense. There is approximately $1.3 billion in net book value of legacy equipment currently in
-
service with shortened estimated useful lives, which is
resulting in accelerated depreciation as of
December 31, 2012
. In addition, capital expenditures of approximately $205 million related to legacy
equipment are included in construction in progress as of
December 31, 2012
, which we also expect to have a shortened estimated useful life when
placed in
-
service. Furthermore, based on current estimates of increased data usage, we expect additional capital expenditures of legacy equipment until
Network Vision is substantially complete.
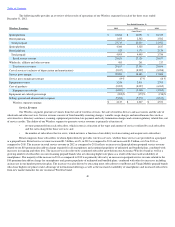
RESULTS OF OPERATIONS
Consolidated segment earnings decreased
$269 million
, or 5%
, in
2012
compared to
2011
and
$561 million
, or
10%
, in
2011
compared to
2010.
Consolidated segment earnings consist of our Wireless and Wireline segments, which are discussed below, and Corporate, other and eliminations.
Depreciation and Amortization Expense
Depreciation expense increased
$1.8 billion
, or
40%
, in
2012
compared to
2011
. The Network Vision deployment is resulting in incremental
charges during the period of implementation including, but not limited to, an increase in depreciation associated with existing assets related to both the
Nextel and Sprint platforms, due to changes in our estimates of the remaining useful lives of long
-
lived assets, and the expected timing and amount of
asset retirement obligations, which we expect to continue to have a material impact on our results of operations during 2013. In
2012
, the incremental
effect of accelerated depreciation due to the implementation of Network Vision was approximately
$2.1 billion
, of which the majority related to the
Nextel platform. The increase related to accelerated depreciation was slightly offset by a net decrease in depreciation as a result of assets that became
fully depreciated or were retired. We expect that the amount of accelerated depreciation in 2013 will be lower than 2012, primarily as a result of our
initial phase of taking Nextel platform sites off
-
air which occurred within the first two quarters of 2012. Although we expect the amount of accelerated
depreciation related to the Nextel platform to
36
Year Ended December 31,
2012
2011
2010
(in millions)
Wireless segment earnings
$
4,147
$
4,267
$
4,531
Wireline segment earnings
649
800
1,090
Corporate, other and eliminations
7
5
12
Consolidated segment earnings
4,803
5,072
5,633
Depreciation and amortization
(6,543
)
(4,858
)
(6,248
)
Other, net
(80
)
(106
)
20
Operating (loss) income
(1,820
)
108
(595
)
Interest expense
(1,428
)
(1,011
)
(1,464
)
Equity in losses of unconsolidated investments, net
(1,114
)
(1,730
)
(1,286
)
Other income (expense), net
190
(3
)
46
Income tax expense
(154
)
(254
)
(166
)
Net loss
$
(4,326
)
$
(2,890
)
$
(3,465
)