Sprint - Nextel 2012 Annual Report Download - page 50
Download and view the complete annual report
Please find page 50 of the 2012 Sprint - Nextel annual report below. You can navigate through the pages in the report by either clicking on the pages listed below, or by using the keyword search tool below to find specific information within the annual report.-
 1
1 -
2
-
3
-
4
-
5
-
6
-
7
-
8
-
9
-
10
-
11
-
12
-
13
-
14
-
15
-
16
-
17
-
18
-
19
-
20
-
21
-
22
-
23
-
24
-
25
-
26
-
27
-
28
-
29
-
30
-
31
-
32
-
33
-
34
-
35
-
36
-
37
-
38
-
39
-
 40
40 -
 41
41 -
 42
42 -
 43
43 -
 44
44 -
 45
45 -
 46
46 -
 47
47 -
 48
48 -
 49
49 -
 50
50 -
 51
51 -
 52
52 -
 53
53 -
 54
54 -
 55
55 -
 56
56 -
 57
57 -
 58
58 -
 59
59 -
 60
60 -
61
-
62
-
63
-
64
-
65
-
66
-
67
-
68
-
69
-
70
-
71
-
72
-
73
-
74
-
75
-
76
-
77
-
78
-
79
-
80
-
81
-
82
-
83
-
84
-
85
-
86
-
87
-
88
-
89
-
90
-
91
-
92
-
93
-
94
-
95
-
96
-
97
-
98
-
99
-
100
-
101
-
102
-
103
-
104
-
105
-
106
-
107
-
108
-
109
-
110
-
111
-
112
-
113
-
114
-
115
-
116
-
117
-
118
-
119
-
120
-
121
-
122
-
123
-
124
-
125
-
126
-
127
-
128
-
129
-
130
-
131
-
132
-
133
-
134
-
135
-
136
-
137
-
138
-
139
-
140
-
141
-
142
-
143
-
144
-
145
-
146
-
147
-
148
-
149
-
150
-
151
-
152
-
153
-
154
-
155
-
156
-
157
-
158
-
159
-
160
-
161
-
162
-
163
-
164
-
165
-
166
-
167
-
168
-
169
-
170
-
171
-
172
-
173
-
174
-
175
-
176
-
177
-
178
-
179
-
180
-
181
-
182
-
183
-
184
-
185
-
186
-
187
-
188
-
189
-
190
-
191
-
192
-
193
-
194
-
195
-
196
-
197
-
198
-
199
-
200
-
201
-
202
-
203
-
204
-
205
-
206
-
207
-
208
-
209
-
210
-
211
-
212
-
213
-
214
-
215
-
216
-
217
-
218
-
219
-
220
-
221
-
222
-
223
-
224
-
225
-
226
-
227
-
228
-
229
-
230
-
231
-
232
-
233
-
234
-
235
-
236
-
237
-
238
-
239
-
240
-
241
-
242
-
243
-
244
-
245
-
246
-
247
-
248
-
249
-
250
-
251
-
252
-
253
-
254
-
255
-
256
-
257
-
258
-
259
-
260
-
261
-
262
-
263
-
264
-
265
-
266
-
267
-
268
-
269
-
270
-
271
-
272
-
273
-
274
-
275
-
276
-
277
-
278
-
279
-
280
-
281
-
282
-
283
-
284
-
285
-
286
-
287
 |
 |

Table of Contents
include subscribers engaged in these retention programs, however the number of these subscribers as a percentage of our total prepaid subscriber
base has remained consistent over the past four quarters.
Wholesale and Affiliate — Wholesale and affiliate subscribers represent customers that are served on our networks through companies
that resell our wireless services to their subscribers, customers residing in affiliate territories and connected devices that utilize our network. Of the
8.2
million
total subscribers included in wholesale and affiliates, approximately
33%
represent connected devices. Wholesale and affiliate subscriber net
additions were
944,000
during
2012
as compared to
2.7 million
and
994,000
in
2011
and
2010
, respectively, inclusive of net additions of connected
devices totaling
593,000, 217,000
, and
152,000
during
2012, 2011
, and
2010
, respectively. Wholesale and affiliate subscriber net additions declined by
1.8 million
during
2012
as compared to
2011
and increased
1.7 million
during
2011
as compared to
2010
. The decline in wholesale and affiliate subscriber
net additions during
2012
as compared to
2011
was primarily attributable to reduced subscriber net additions from the Lifeline programs offered by our
MVNO's selling prepaid services as well as targeted efforts by our wholesale customers to eliminate inactive accounts. The decrease in net additions
to the Lifeline programs offered by our MVNO's is primarily affected by the new federal regulations, similar to the impact on our Assurance Wireless
brand in "Retail Prepaid" above. We expect the new federal regulations related to the Lifeline programs will result in additional deactivations during
2013. The increase in wholesale and affiliate subscriber net additions during
2011
as compared to
2010
was primarily driven by net additions from the
Lifeline program offered through our MVNO's reselling prepaid services.
Nextel Platform Subscribers
During
2012
, our postpaid subscriber base was reduced by approximately
2.7 million
, of which approximately
1.5 million
were recaptured on
the Sprint platform. We plan to retain Nextel platform push
-
to
-
talk subscribers by providing competitive offerings on the Sprint platform, which
includes offerings on our multi
-
mode network, such as Sprint Direct Connect. During
2012
, our prepaid subscriber base was reduced by
1.5 million
, of
which approximately
620,000
were recaptured on the Sprint platform, as we continued the trend of prepaid subscriber losses. We expect to continue a
trend of net postpaid and prepaid subscriber losses on the Nextel platform through the June 30, 2013 shut
-
down period.
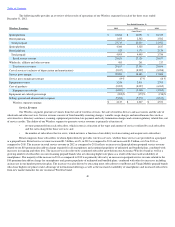
Cost of Services
Cost of services consists primarily of:
Cost of services increased
$110 million
, or 1%
, in
2012
compared to
2011
, reflecting an increase in rent expense primarily due to the cell site
leases renegotiated in 2011 in connection with Network Vision and higher backhaul costs primarily due to increased capacity. These increases were
partially offset by a decrease in payments to third
-
party vendors for use of their proprietary data applications and premium services as a result of more
favorable rates provided by contract renegotiations and a decline in long distance network costs as a result of lower market rates. In addition, service
and repair costs decreased due to a decline in the volume and frequency of repairs, which is slightly offset by an increase in the cost per unit of
devices utilized for service and repair due to the growth
45
•
costs to operate and maintain our networks, including direct switch and cell site costs, such as rent, utilities, maintenance, labor costs
associated with network employees, and spectrum frequency leasing costs;
•
fixed and variable interconnection costs, the fixed component of which consists of monthly flat
-
rate fees for facilities leased from local
exchange carriers based on the number of cell sites and switches in service in a particular period and the related equipment installed at
each site, and the variable component of which generally consists of per
-
minute use fees charged by wireline providers for calls
terminating on their networks, which fluctuate in relation to the level and duration of those terminating calls;
•
long distance costs paid to the Wireline segment;
•
costs to service and repair devices;
•
regulatory fees;
•
roaming fees paid to other carriers; and
•
fixed and variable costs relating to payments to third parties for the use of their proprietary data applications, such as messaging,
music, TV, and navigation services by our subscribers.