Sprint - Nextel 2012 Annual Report Download - page 41
Download and view the complete annual report
Please find page 41 of the 2012 Sprint - Nextel annual report below. You can navigate through the pages in the report by either clicking on the pages listed below, or by using the keyword search tool below to find specific information within the annual report.-
 1
1 -
2
-
3
-
4
-
5
-
6
-
7
-
8
-
9
-
10
-
11
-
12
-
13
-
14
-
15
-
16
-
17
-
18
-
19
-
20
-
21
-
22
-
23
-
24
-
25
-
26
-
27
-
28
-
29
-
30
-
 31
31 -
 32
32 -
 33
33 -
 34
34 -
 35
35 -
 36
36 -
 37
37 -
 38
38 -
 39
39 -
 40
40 -
 41
41 -
 42
42 -
 43
43 -
 44
44 -
 45
45 -
 46
46 -
 47
47 -
 48
48 -
 49
49 -
 50
50 -
 51
51 -
52
-
53
-
54
-
55
-
56
-
57
-
58
-
59
-
60
-
61
-
62
-
63
-
64
-
65
-
66
-
67
-
68
-
69
-
70
-
71
-
72
-
73
-
74
-
75
-
76
-
77
-
78
-
79
-
80
-
81
-
82
-
83
-
84
-
85
-
86
-
87
-
88
-
89
-
90
-
91
-
92
-
93
-
94
-
95
-
96
-
97
-
98
-
99
-
100
-
101
-
102
-
103
-
104
-
105
-
106
-
107
-
108
-
109
-
110
-
111
-
112
-
113
-
114
-
115
-
116
-
117
-
118
-
119
-
120
-
121
-
122
-
123
-
124
-
125
-
126
-
127
-
128
-
129
-
130
-
131
-
132
-
133
-
134
-
135
-
136
-
137
-
138
-
139
-
140
-
141
-
142
-
143
-
144
-
145
-
146
-
147
-
148
-
149
-
150
-
151
-
152
-
153
-
154
-
155
-
156
-
157
-
158
-
159
-
160
-
161
-
162
-
163
-
164
-
165
-
166
-
167
-
168
-
169
-
170
-
171
-
172
-
173
-
174
-
175
-
176
-
177
-
178
-
179
-
180
-
181
-
182
-
183
-
184
-
185
-
186
-
187
-
188
-
189
-
190
-
191
-
192
-
193
-
194
-
195
-
196
-
197
-
198
-
199
-
200
-
201
-
202
-
203
-
204
-
205
-
206
-
207
-
208
-
209
-
210
-
211
-
212
-
213
-
214
-
215
-
216
-
217
-
218
-
219
-
220
-
221
-
222
-
223
-
224
-
225
-
226
-
227
-
228
-
229
-
230
-
231
-
232
-
233
-
234
-
235
-
236
-
237
-
238
-
239
-
240
-
241
-
242
-
243
-
244
-
245
-
246
-
247
-
248
-
249
-
250
-
251
-
252
-
253
-
254
-
255
-
256
-
257
-
258
-
259
-
260
-
261
-
262
-
263
-
264
-
265
-
266
-
267
-
268
-
269
-
270
-
271
-
272
-
273
-
274
-
275
-
276
-
277
-
278
-
279
-
280
-
281
-
282
-
283
-
284
-
285
-
286
-
287
 |
 |

Table of Contents
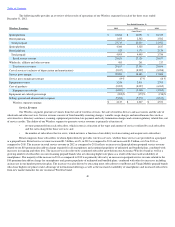
Consolidated Financial Statements. Gains from asset dispositions and exchanges for 2012 and 2010 are primarily related to spectrum exchange
transactions.
The amounts reflected in Other for 2012 consist of $45 million of hurricane
-
related costs and $19 million of expenses associated with
business combinations offset by $17 million in benefits resulting from favorable developments relating to access cost disputes with certain exchange
carriers. The amounts reflected in "Other" in 2010 were primarily related to benefits resulting from favorable developments relating to access cost
disputes with certain exchange carriers.
Interest Expense
Interest expense increased
$417 million
, or
41%
, in
2012
as compared to
2011
, primarily due to increased weighted average long
-
term debt
balances as a result of 2011 and 2012 debt issuances partially offset by 2011 and 2012 debt repayments (see Notes to the Consolidated Financial
Statements for details on debt issuances and repayments), in addition to increased effective interest rates combined with reductions in the amount of
interest capitalized primarily related to spectrum licenses. We expect interest capitalization related to spectrum licenses not previously utilized to
continue to decline as a substantial portion of the value of our spectrum licenses used for Network Vision are now ready for use. Interest expense
decreased
$453 million
, or
31%
, in
2011
as compared to
2010
primarily due to a
$400 million
increase in the amount of interest capitalized. The increase
in capitalized interest was related to our plan to deploy certain spectrum licenses as part of Network Vision that were not previously utilized. The
reduction in interest expense also includes a decrease of $115 million as a result of the repayment of
$1.65 billion
of Sprint Capital Corporation
7.625%
senior notes in January 2011. The decrease was partially offset by increases in interest expense of $54 million as a result of the November 2011 Sprint
Nextel Corporation issuance of
$1 billion
in principal of
11.50%
senior notes due 2021 and
$3 billion
in principal of
9.00%
guaranteed notes due 2018.
The effective interest rate, which includes capitalized interest, on the weighted average long
-
term debt balance of
$22.0 billion
,
$19.1 billion
, and
$20.6
billion
was
7.8%
,
7.4%
, and
7.2%
for
2012, 2011
and
2010
, respectively. See “Liquidity and Capital Resources” for more information on the Company's
financing activities.
Equity in Losses of Unconsolidated Investments, net
Clearwire owns and operates a next generation mobile broadband network that provides high
-
speed residential and mobile Internet access
services and residential voice services in communities throughout the country. On December 17, 2012, Sprint entered into a definitive agreement with
Clearwire Corporation to acquire the remaining interest Sprint does not currently own for $2.97 per share for a total payment of approximately $2.2
billion to Clearwire Corporation shareholders.
Equity in losses of unconsolidated investments primarily consists of our proportionate share of losses from our equity method
investments. Equity in losses associated with our investment in Clearwire consists of Sprint's share of Clearwire's net loss and other adjustments such
as gains or losses associated with the dilution of Sprint's ownership interest resulting from Clearwire's equity issuances, Sprint's impairment, if any, of
its investment in Clearwire, and other items recognized by Clearwire Corporation that do not effect Sprint's economic interest. Equity in losses from
Clearwire were
$1.1 billion
,
$1.7 billion
, and
$1.3 billion
for
2012, 2011
and
2010
, respectively. Equity in losses from Clearwire for
2012, 2011
and
2010
include charges of approximately
$41 million
,
$361 million
and
$97 million
, respectively, which are associated with Clearwire's write
-
off of certain
network and other assets that no longer meet their strategic plans.
The years ended
December 31, 2012
and
2011
also include a
$204 million
and
$135 million
, respectively, pre
-
tax impairment reflecting Sprint's
reduction in the carrying value of its investment in Clearwire to an estimated fair value. In addition, the year ended
December 31, 2011
also includes a
dilution loss of approximately
$27 million
associated with the fourth quarter reduction of our non
-
controlling economic interest related to Clearwire's
equity issuance.
Other income (expense), net
Other income (expense), net changed $193 million in
2012
as compared to
2011
primarily as a result of an increase in interest income from the
additional promissory note received from Clearwire in January 2012 as well as gains on our early retirement of all of our remaining Nextel
Communications, Inc. notes. The change of $49 million in
2011
as compared to
2010
was primarily a result of losses on early retirement of debt in 2011
due to the redemption of all of our remaining Sprint Capital Corporation 8.375% senior notes.
38