Sprint - Nextel 2012 Annual Report Download - page 35
Download and view the complete annual report
Please find page 35 of the 2012 Sprint - Nextel annual report below. You can navigate through the pages in the report by either clicking on the pages listed below, or by using the keyword search tool below to find specific information within the annual report.-
 1
1 -
2
-
3
-
4
-
5
-
6
-
7
-
8
-
9
-
10
-
11
-
12
-
13
-
14
-
15
-
16
-
17
-
18
-
19
-
20
-
21
-
22
-
23
-
24
-
 25
25 -
 26
26 -
 27
27 -
 28
28 -
 29
29 -
 30
30 -
 31
31 -
 32
32 -
 33
33 -
 34
34 -
 35
35 -
 36
36 -
 37
37 -
 38
38 -
 39
39 -
 40
40 -
 41
41 -
 42
42 -
 43
43 -
 44
44 -
 45
45 -
46
-
47
-
48
-
49
-
50
-
51
-
52
-
53
-
54
-
55
-
56
-
57
-
58
-
59
-
60
-
61
-
62
-
63
-
64
-
65
-
66
-
67
-
68
-
69
-
70
-
71
-
72
-
73
-
74
-
75
-
76
-
77
-
78
-
79
-
80
-
81
-
82
-
83
-
84
-
85
-
86
-
87
-
88
-
89
-
90
-
91
-
92
-
93
-
94
-
95
-
96
-
97
-
98
-
99
-
100
-
101
-
102
-
103
-
104
-
105
-
106
-
107
-
108
-
109
-
110
-
111
-
112
-
113
-
114
-
115
-
116
-
117
-
118
-
119
-
120
-
121
-
122
-
123
-
124
-
125
-
126
-
127
-
128
-
129
-
130
-
131
-
132
-
133
-
134
-
135
-
136
-
137
-
138
-
139
-
140
-
141
-
142
-
143
-
144
-
145
-
146
-
147
-
148
-
149
-
150
-
151
-
152
-
153
-
154
-
155
-
156
-
157
-
158
-
159
-
160
-
161
-
162
-
163
-
164
-
165
-
166
-
167
-
168
-
169
-
170
-
171
-
172
-
173
-
174
-
175
-
176
-
177
-
178
-
179
-
180
-
181
-
182
-
183
-
184
-
185
-
186
-
187
-
188
-
189
-
190
-
191
-
192
-
193
-
194
-
195
-
196
-
197
-
198
-
199
-
200
-
201
-
202
-
203
-
204
-
205
-
206
-
207
-
208
-
209
-
210
-
211
-
212
-
213
-
214
-
215
-
216
-
217
-
218
-
219
-
220
-
221
-
222
-
223
-
224
-
225
-
226
-
227
-
228
-
229
-
230
-
231
-
232
-
233
-
234
-
235
-
236
-
237
-
238
-
239
-
240
-
241
-
242
-
243
-
244
-
245
-
246
-
247
-
248
-
249
-
250
-
251
-
252
-
253
-
254
-
255
-
256
-
257
-
258
-
259
-
260
-
261
-
262
-
263
-
264
-
265
-
266
-
267
-
268
-
269
-
270
-
271
-
272
-
273
-
274
-
275
-
276
-
277
-
278
-
279
-
280
-
281
-
282
-
283
-
284
-
285
-
286
-
287
 |
 |

Table of Contents
The selected financial data presented below is not comparable for all periods presented primarily as a result of transactions such as the
acquisitions of Virgin Mobile USA, Inc. (Virgin Mobile) and Affiliates in 2009, as well as the November 2008 contribution of our WiMAX wireless
network to Clearwire. The acquired companies' results of operations subsequent to their acquisition dates are included in our consolidated financial
statements. The
2012
increase in net operating revenues as compared to the prior year was primarily due to an increase in postpaid average revenue
per subscriber, continued prepaid subscriber net additions, and increased equipment revenue primarily due to a higher average sales price for both
postpaid and prepaid devices. The primary reason for the increase in net operating revenues for
2011
as compared to the prior year was an increase in
postpaid average revenue per subscriber and total retail wireless subscribers net additions of 2.4 million. The
2010
increase in net operating revenues
as compared to the prior year was primarily related to the total retail wireless subscribers net additions of 783,000 and the additional subscribers
obtained in our 2009 acquisitions. We lost approximately 1.0 million retail wireless subscribers in
2009
and 5.1 million in 2008, which caused the majority
of the reduction in net operating revenues in
2009.
_______________
32
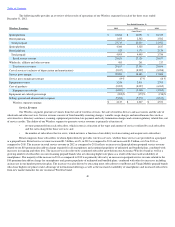
Item 6.
Selected Financial Data
Year Ended December 31,
2012
2011
2010
2009
2008
(in millions, except per share amounts)
Results of Operations
Net operating revenues
$
35,345
$
33,679
$
32,563
$
32,260
$
35,635
Goodwill impairment
—
—
—
—
963
Depreciation and amortization
6,543
4,858
6,248
7,416
8,407
Operating (loss) income(1)
(1,820
)
108
(595
)
(1,398
)
(2,642
)
Net loss(1)(2)
(4,326
)
(2,890
)
(3,465
)
(2,436
)
(2,796
)
Loss per Share and Dividends
(3)
Basic and diluted loss per common share(1)(2)
$
(1.44
)
$
(0.96
)
$
(1.16
)
$
(0.84
)
$
(0.98
)
Financial Position
Total assets
$
51,570
$
49,383
$
51,654
$
55,424
$
58,550
Property, plant and equipment, net
13,607
14,009
15,214
18,280
22,373
Intangible assets, net
22,371
22,428
22,704
23,462
22,886
Total debt, capital lease and financing obligations (including
equity unit notes)
24,341
20,274
20,191
21,061
21,610
Shareholders' equity
7,087
11,427
14,546
18,095
19,915
Cash Flow Data
Net cash provided by operating activities
$
2,999
$
3,691
$
4,815
$
4,891
$
6,179
Capital expenditures
4,261
3,130
1,935
1,603
3,882
(1)
In 2012, operating income decreased
$1.9 billion
from the prior year resulting in an operating loss primarily due to increases in operating expenses of
$3.6 billion
partially offset by the increase in net operating revenues of
$1.7 billion
. The increases in operating expenses are due to the incremental effect of accelerated
depreciation due to the implementation of Network Vision, which was approximately
$2.1 billion
, of which the majority related to the Nextel platform. The increase
related to accelerated depreciation was slightly offset by a net decrease in depreciation as a result of assets that became fully depreciated or were retired. In
addition, wireless cost of products increased approximately
$1.8 billion
primarily due to higher cost of postpaid and prepaid devices. In 2011, operating income
improved $703 million primarily due to the increase in net operating revenues of
$1.1 billion
as well as decreases in depreciation and amortization associated with
a reduction in the replacement rate of assets in 2009 through 2011, and definite lived intangible assets becoming fully amortized. These changes were offset by
increases in operating expenses of $413 million as a result of increases in wireless cost of services associated with 4G MVNO roaming due to higher data usage
and increased wireless cost of products primarily related to higher cost of postpaid and prepaid devices. In 2010, operating loss improved $803 million primarily
due to the increase in net operating revenues of $303 million in addition to decreases in operating expenses of $500 million as a result of our cost cutting initiatives
in prior periods. In 2009, we recognized net charges of $389 million ($248 million after tax) primarily related to asset impairments other than goodwill, severance
and exit costs, and merger and integration costs. In 2008, we recognized net charges of $936 million ($586 million after tax) primarily related to merger and
integration costs, asset impairments other than goodwill, and severance and exit costs.
(2)
During 2012 and 2011, the Company did not recognize significant tax benefits associated with federal and state net operating losses generated during the periods
due to its history of consecutive annual losses. As a result, the Company recognized an increase in the valuation allowance on deferred tax assets affecting the
income tax provision by approximately
$1.8 billion
,
$1.2 billion
, and
$1.4 billion
for the years ended December 31, 2012, 2011 and 2010
, respectively.
(3)
We did not declare any dividends on our common shares in any of the periods reported.