Sprint - Nextel 2012 Annual Report Download - page 51
Download and view the complete annual report
Please find page 51 of the 2012 Sprint - Nextel annual report below. You can navigate through the pages in the report by either clicking on the pages listed below, or by using the keyword search tool below to find specific information within the annual report.-
 1
1 -
2
-
3
-
4
-
5
-
6
-
7
-
8
-
9
-
10
-
11
-
12
-
13
-
14
-
15
-
16
-
17
-
18
-
19
-
20
-
21
-
22
-
23
-
24
-
25
-
26
-
27
-
28
-
29
-
30
-
31
-
32
-
33
-
34
-
35
-
36
-
37
-
38
-
39
-
40
-
 41
41 -
 42
42 -
 43
43 -
 44
44 -
 45
45 -
 46
46 -
 47
47 -
 48
48 -
 49
49 -
 50
50 -
 51
51 -
 52
52 -
 53
53 -
 54
54 -
 55
55 -
 56
56 -
 57
57 -
 58
58 -
 59
59 -
 60
60 -
 61
61 -
62
-
63
-
64
-
65
-
66
-
67
-
68
-
69
-
70
-
71
-
72
-
73
-
74
-
75
-
76
-
77
-
78
-
79
-
80
-
81
-
82
-
83
-
84
-
85
-
86
-
87
-
88
-
89
-
90
-
91
-
92
-
93
-
94
-
95
-
96
-
97
-
98
-
99
-
100
-
101
-
102
-
103
-
104
-
105
-
106
-
107
-
108
-
109
-
110
-
111
-
112
-
113
-
114
-
115
-
116
-
117
-
118
-
119
-
120
-
121
-
122
-
123
-
124
-
125
-
126
-
127
-
128
-
129
-
130
-
131
-
132
-
133
-
134
-
135
-
136
-
137
-
138
-
139
-
140
-
141
-
142
-
143
-
144
-
145
-
146
-
147
-
148
-
149
-
150
-
151
-
152
-
153
-
154
-
155
-
156
-
157
-
158
-
159
-
160
-
161
-
162
-
163
-
164
-
165
-
166
-
167
-
168
-
169
-
170
-
171
-
172
-
173
-
174
-
175
-
176
-
177
-
178
-
179
-
180
-
181
-
182
-
183
-
184
-
185
-
186
-
187
-
188
-
189
-
190
-
191
-
192
-
193
-
194
-
195
-
196
-
197
-
198
-
199
-
200
-
201
-
202
-
203
-
204
-
205
-
206
-
207
-
208
-
209
-
210
-
211
-
212
-
213
-
214
-
215
-
216
-
217
-
218
-
219
-
220
-
221
-
222
-
223
-
224
-
225
-
226
-
227
-
228
-
229
-
230
-
231
-
232
-
233
-
234
-
235
-
236
-
237
-
238
-
239
-
240
-
241
-
242
-
243
-
244
-
245
-
246
-
247
-
248
-
249
-
250
-
251
-
252
-
253
-
254
-
255
-
256
-
257
-
258
-
259
-
260
-
261
-
262
-
263
-
264
-
265
-
266
-
267
-
268
-
269
-
270
-
271
-
272
-
273
-
274
-
275
-
276
-
277
-
278
-
279
-
280
-
281
-
282
-
283
-
284
-
285
-
286
-
287
 |
 |

Table of Contents
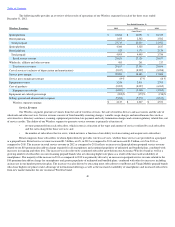
in smartphone popularity. As we achieved the 2012 plan to take 9,600 Nextel platform cell sites off
-
air, utility, backhaul and rent expense related to
these sites began to decline in the last half of 2012. Further reductions are expected in the second half of 2013 as we expect to recognize the full amount
of lease exit costs associated with the shut
-
down of the remaining Nextel platform cell sites by June 30, 2013.
Cost of services increased
$619 million
, or 7%
, in
2011
as compared to
2010
primarily reflecting increased roaming due to higher Clearwire
MVNO data usage. In addition, higher service and repair costs were incurred driven by the increase in the cost per unit of new and used devices due
to the growth in smartphone popularity. These increases were partially offset by a decrease in long distance network costs as a result of lower market
rates and a decline in payments to third
-
party vendors for use of their proprietary data applications and premium services as a result of contract
renegotiations, providing more favorable rates.
Equipment Net Subsidy
We recognize equipment revenue and corresponding costs of devices when title and risk of loss passes to the indirect dealer or end
-
use
customer, assuming all other revenue recognition criteria are met. Our marketing plans assume that devices typically will be sold at prices below cost,
which is consistent with industry practice. We offer certain incentives to retain and acquire subscribers such as new devices at discounted prices. The
cost of these incentives is recorded as a reduction to equipment revenue upon activation of the device with a service contract.
Cost of products includes equipment costs (primarily devices and accessories), order fulfillment related expenses, and write
-
downs of
device and accessory inventory related to shrinkage and obsolescence. Additionally, cost of products is reduced by any rebates that are earned from
the equipment manufacturers. Cost of products in excess of the net revenue generated from equipment sales is referred to in the industry as equipment
net subsidy. We also make incentive payments to certain indirect dealers, who purchase the iPhone® directly from Apple. Those payments are
recognized as selling, general and administrative expenses when the device is activated with a Sprint service plan because Sprint does not recognize
any equipment revenue or cost of products for those transactions. (See Selling, General and Administrative Expense below.)
Equipment revenue increased
$337 million
, or
12%
, in
2012
compared to
2011
and cost of products increased
$1.8 billion
, or
23%
, in
2012
compared to
2011
. The increase in both equipment revenue and cost of products is primarily due to a higher average sales price and cost per device
sold for postpaid and prepaid devices, particularly driven by the introduction of the more expensive iPhone to postpaid and prepaid subscribers,
partially offset by a decline in the number of postpaid and prepaid devices sold. Equipment revenue increased
$208 million
, or 8%
, in
2011
compared to
2010
and cost of products increased
$1.1 billion
, or
16%
, in
2011
compared to
2010
primarily due to a higher average sales price and cost per device
sold for both postpaid and prepaid devices in addition to an overall increase in the number of prepaid devices sold, partially offset by a decline in the
number of postpaid devices sold. As a result of a growing number of postpaid and prepaid subscribers moving to smartphone devices, we expect the
trend of increased equipment net subsidy to continue.
Selling, General and Administrative Expense
Sales and marketing costs primarily consist of customer acquisition costs, including commissions paid to our indirect dealers, third
-
party
distributors and retail sales force for new device activations and upgrades, residual payments to our indirect dealers, payments made to OEMs for
direct source equipment, payroll and facilities costs associated with our retail sales force, marketing employees, advertising, media programs and
sponsorships, including costs related to branding. General and administrative expenses primarily consist of costs for billing, customer care and
information technology operations, bad debt expense and administrative support activities, including collections, legal, finance, human resources,
corporate communications, strategic planning, and technology and product development.
Sales and marketing expense was
$5.3 billion
, an increase of
$165 million
, or 3%
, in
2012
from
2011
and
$5.1 billion
, an increase of
$246
million
, or 5%
, in
2011
from
2010
. The increase in sales and marketing expenses for the year ended
December 31, 2012
as compared to the prior period is
primarily due to increased reimbursements for point
-
of
-
sale discounts for iPhones of $238 million, which are directly sourced by distributors from
Apple and accounted for as sales expense, partially offset by a reduction in commissions expense resulting from a shift in channel mix combined with
our decrease in subscriber gross additions. Point
-
of
-
sale discounts are included in the determination of equipment net subsidy when we purchase and
resell devices. The increase in sales and marketing expenses for the year ended
December 31, 2011
as compared to the prior period was also due to
reimbursements for
46