Sprint - Nextel 2012 Annual Report Download - page 52
Download and view the complete annual report
Please find page 52 of the 2012 Sprint - Nextel annual report below. You can navigate through the pages in the report by either clicking on the pages listed below, or by using the keyword search tool below to find specific information within the annual report.-
 1
1 -
2
-
3
-
4
-
5
-
6
-
7
-
8
-
9
-
10
-
11
-
12
-
13
-
14
-
15
-
16
-
17
-
18
-
19
-
20
-
21
-
22
-
23
-
24
-
25
-
26
-
27
-
28
-
29
-
30
-
31
-
32
-
33
-
34
-
35
-
36
-
37
-
38
-
39
-
40
-
41
-
 42
42 -
 43
43 -
 44
44 -
 45
45 -
 46
46 -
 47
47 -
 48
48 -
 49
49 -
 50
50 -
 51
51 -
 52
52 -
 53
53 -
 54
54 -
 55
55 -
 56
56 -
 57
57 -
 58
58 -
 59
59 -
 60
60 -
 61
61 -
 62
62 -
63
-
64
-
65
-
66
-
67
-
68
-
69
-
70
-
71
-
72
-
73
-
74
-
75
-
76
-
77
-
78
-
79
-
80
-
81
-
82
-
83
-
84
-
85
-
86
-
87
-
88
-
89
-
90
-
91
-
92
-
93
-
94
-
95
-
96
-
97
-
98
-
99
-
100
-
101
-
102
-
103
-
104
-
105
-
106
-
107
-
108
-
109
-
110
-
111
-
112
-
113
-
114
-
115
-
116
-
117
-
118
-
119
-
120
-
121
-
122
-
123
-
124
-
125
-
126
-
127
-
128
-
129
-
130
-
131
-
132
-
133
-
134
-
135
-
136
-
137
-
138
-
139
-
140
-
141
-
142
-
143
-
144
-
145
-
146
-
147
-
148
-
149
-
150
-
151
-
152
-
153
-
154
-
155
-
156
-
157
-
158
-
159
-
160
-
161
-
162
-
163
-
164
-
165
-
166
-
167
-
168
-
169
-
170
-
171
-
172
-
173
-
174
-
175
-
176
-
177
-
178
-
179
-
180
-
181
-
182
-
183
-
184
-
185
-
186
-
187
-
188
-
189
-
190
-
191
-
192
-
193
-
194
-
195
-
196
-
197
-
198
-
199
-
200
-
201
-
202
-
203
-
204
-
205
-
206
-
207
-
208
-
209
-
210
-
211
-
212
-
213
-
214
-
215
-
216
-
217
-
218
-
219
-
220
-
221
-
222
-
223
-
224
-
225
-
226
-
227
-
228
-
229
-
230
-
231
-
232
-
233
-
234
-
235
-
236
-
237
-
238
-
239
-
240
-
241
-
242
-
243
-
244
-
245
-
246
-
247
-
248
-
249
-
250
-
251
-
252
-
253
-
254
-
255
-
256
-
257
-
258
-
259
-
260
-
261
-
262
-
263
-
264
-
265
-
266
-
267
-
268
-
269
-
270
-
271
-
272
-
273
-
274
-
275
-
276
-
277
-
278
-
279
-
280
-
281
-
282
-
283
-
284
-
285
-
286
-
287
 |
 |

Table of Contents
point
-
of
-
sale discounts for iPhones, introduced in fourth quarter of 2011, as well as the additional costs associated with our increase in subscriber
gross additions, slightly offset by a decrease in media spend.
General and administrative costs were approximately
$4.0 billion
in both
2012
and
2011
with an increase of
$51 million
in
2012
from
2011
and
$11 million
in
2011
from
2010
. The majority of the increase in general and administrative costs for the year ended
December 31, 2012
reflects higher
employee
-
related costs, offset by a decrease in customer care costs primarily due to lower call volumes. The increase for the year ended
December 31,
2011
reflects an increase in bad debt expense partially offset by a reduction in customer care costs as well as reductions in prepaid integration costs
incurred in 2010 associated with our business acquisitions. The continued improvement in customer care costs is largely attributable to customer care
quality initiatives and price plan simplification that have resulted in a reduction in calls per subscriber, which allowed for further optimization of call
center resources. Bad debt expense was
$541 million
for the year ended
December 31, 2012
, representing an
$11 million
decrease as compared to bad
debt expense of
$552 million
in
2011
. For the year ended
December 31, 2011
, bad debt expense increased
$129 million
as compared to bad debt expense
of
$423 million
in
2010
, reflecting an increase in the aging of accounts receivable outstanding greater than 60 days combined with an increase in the
average write
-
off per account. We reassess our allowance for doubtful accounts quarterly. Changes in our allowance for doubtful accounts are largely
attributable to the analysis of historical collection experience and changes, if any, in credit policies established for subscribers. Our mix of prime
postpaid subscribers to total postpaid subscribers was
82%
as of
December 31, 2012
and
2011.
Segment Earnings
-
Wireline
Wireline segment earnings are primarily a function of wireline service revenue, network and interconnection costs, and other Wireline
segment operating expenses. Network costs primarily represent special access costs and interconnection costs, which generally consist of domestic
and international per
-
minute usage fees paid to other carriers. The remaining costs associated with operating the Wireline segment include the costs to
operate our customer care and billing organizations in addition to administrative support. Wireline service revenue and variable network and
interconnection costs fluctuate with the changes in our customer base and their related usage, but some cost elements do not fluctuate in the short
term with the changes in our customer usage. Our wireline services provided to our Wireless segment are generally accounted for based on market
rates, which we believe approximate fair value. The Company generally re
-
establishes these rates at the beginning of each fiscal year. Over the past
several years, there has been an industry wide trend of lower rates due to increased competition from other wireline and wireless communications
companies as well as cable and Internet service providers. For 2013, we expect wireline segment earnings to decline by approximately $80 to $120
million to reflect changes in market prices for services provided by our Wireline segment to our Wireless segment. This decline in wireline segment
earnings related to intercompany pricing will not affect our consolidated results of operations as our Wireless segment will benefit from an equivalent
reduction in cost of service.
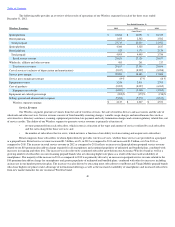
The following table provides an overview of the results of operations of our Wireline segment for the years ended
December 31, 2012
, 2011
and
2010.
47
Year Ended December 31,
Wireline Earnings
2012
2011
2010
(in millions)
Voice
$
1,627
$
1,915
$
2,249
Data
398
460
519
Internet
1,781
1,878
2,175
Other
75
73
97
Total net service revenue
3,881
4,326
5,040
Cost of services and products
(2,781
)
(3,005
)
(3,319
)
Service gross margin
1,100
1,321
1,721
Service gross margin percentage
28
%
31
%
34
%
Selling, general and administrative expense
(451
)
(521
)
(631
)
Wireline segment earnings
$
649
$
800
$
1,090