Sprint - Nextel 2012 Annual Report Download - page 53
Download and view the complete annual report
Please find page 53 of the 2012 Sprint - Nextel annual report below. You can navigate through the pages in the report by either clicking on the pages listed below, or by using the keyword search tool below to find specific information within the annual report.-
 1
1 -
2
-
3
-
4
-
5
-
6
-
7
-
8
-
9
-
10
-
11
-
12
-
13
-
14
-
15
-
16
-
17
-
18
-
19
-
20
-
21
-
22
-
23
-
24
-
25
-
26
-
27
-
28
-
29
-
30
-
31
-
32
-
33
-
34
-
35
-
36
-
37
-
38
-
39
-
40
-
41
-
42
-
 43
43 -
 44
44 -
 45
45 -
 46
46 -
 47
47 -
 48
48 -
 49
49 -
 50
50 -
 51
51 -
 52
52 -
 53
53 -
 54
54 -
 55
55 -
 56
56 -
 57
57 -
 58
58 -
 59
59 -
 60
60 -
 61
61 -
 62
62 -
 63
63 -
64
-
65
-
66
-
67
-
68
-
69
-
70
-
71
-
72
-
73
-
74
-
75
-
76
-
77
-
78
-
79
-
80
-
81
-
82
-
83
-
84
-
85
-
86
-
87
-
88
-
89
-
90
-
91
-
92
-
93
-
94
-
95
-
96
-
97
-
98
-
99
-
100
-
101
-
102
-
103
-
104
-
105
-
106
-
107
-
108
-
109
-
110
-
111
-
112
-
113
-
114
-
115
-
116
-
117
-
118
-
119
-
120
-
121
-
122
-
123
-
124
-
125
-
126
-
127
-
128
-
129
-
130
-
131
-
132
-
133
-
134
-
135
-
136
-
137
-
138
-
139
-
140
-
141
-
142
-
143
-
144
-
145
-
146
-
147
-
148
-
149
-
150
-
151
-
152
-
153
-
154
-
155
-
156
-
157
-
158
-
159
-
160
-
161
-
162
-
163
-
164
-
165
-
166
-
167
-
168
-
169
-
170
-
171
-
172
-
173
-
174
-
175
-
176
-
177
-
178
-
179
-
180
-
181
-
182
-
183
-
184
-
185
-
186
-
187
-
188
-
189
-
190
-
191
-
192
-
193
-
194
-
195
-
196
-
197
-
198
-
199
-
200
-
201
-
202
-
203
-
204
-
205
-
206
-
207
-
208
-
209
-
210
-
211
-
212
-
213
-
214
-
215
-
216
-
217
-
218
-
219
-
220
-
221
-
222
-
223
-
224
-
225
-
226
-
227
-
228
-
229
-
230
-
231
-
232
-
233
-
234
-
235
-
236
-
237
-
238
-
239
-
240
-
241
-
242
-
243
-
244
-
245
-
246
-
247
-
248
-
249
-
250
-
251
-
252
-
253
-
254
-
255
-
256
-
257
-
258
-
259
-
260
-
261
-
262
-
263
-
264
-
265
-
266
-
267
-
268
-
269
-
270
-
271
-
272
-
273
-
274
-
275
-
276
-
277
-
278
-
279
-
280
-
281
-
282
-
283
-
284
-
285
-
286
-
287
 |
 |

Table of Contents
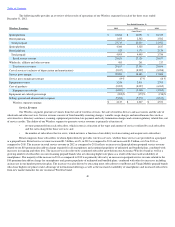
Wireline Revenue
Voice Revenues
Voice revenues decreased
$288 million
, or
15%
, in
2012
as compared to
2011
and
$334 million
, or
15%
, in
2011
as compared to
2010
. The
2012
decrease was primarily driven by overall price declines of which $174 million was related to the decline in prices for the sale of services to our Wireless
segment as well as volume declines due to customer churn. The
2011
decrease was also primarily driven by volume declines due to customer churn as
well as overall price declines. Voice revenues generated from the sale of services to our Wireless segment represented
32%
of total voice revenues in
2012
as compared to
34%
in
2011
and
33%
in
2010.
Data Revenues
Data revenues reflect sales of data services, primarily Private Line, and also includes ATM, frame relay and managed network services
bundled with non
-
IP data access. Data revenues decreased
$62 million
, or
13%
, in
2012
as compared to
2011
and
$59 million
, or
11%
, in
2011
as
compared to
2010
as a result of customer churn driven by the focus to no longer provide frame relay and ATM services in each of those periods. Data
revenues generated from the provision of services to the Wireless segment represented
44%
of total data revenue in
2012
as compared to
35%
in
2011
and
27%
in
2010.
Internet Revenues
Internet revenues reflect sales of IP
-
based data services, including MPLS, VoIP and SIP and managed services bundled with IP
-
based data
access. Internet revenues decreased
$97 million
, or 5%
, in
2012
from
2011
and
$297 million
, or
14%
, in
2011
from
2010
. Certain cable MSO's have
decided to in
-
source their digital voice products resulting in a $98 million decrease in
2012
as compared to
2011
. The
2011
decrease was primarily due to
the in
-
sourcing of their digital voice products by certain cable MSO's, combined with a decline in prices related to the sale of services to our Wireless
segment. Internet revenues generated from the provision of services to the Wireless segment represented
11%
of total Internet revenues in
2012
as
compared to 8% in
2011
and
10%
in
2010.
Other Revenues
Other revenues, which primarily consist of sales of customer premises equipment, increased by
$2 million
, or 3% in
2012
as compared to
2011
and decreased
$24 million
, or
25%
, in
2011
as compared to
2010
as a result of fewer projects in 2011.
Costs of Services and Products
Costs of services and products include access costs paid to local phone companies, other domestic service providers and foreign phone
companies to complete calls made by our domestic subscribers, costs to operate and maintain our networks, and costs of equipment. Costs of services
and products decreased
$224 million
, or 7%
, in
2012
from
2011
and
$314 million
, or 9%
, in
2011
from
2010
. The decrease in
2012
and
2011
was primarily
due to lower access expense as a result of savings initiatives and declining voice, data and Internet volumes. Service gross margin percentage
decreased from 34% in
2010
to 31% in
2011
and further decreased to
28%
in
2012
as a result of a decrease in net service revenue partially offset by a
decrease in costs of services and products.
Selling, General and Administrative Expense
Selling, general and administrative expense decreased
$70 million
, or
13%
, in
2012
as compared to
2011
and
$110 million
, or
17%
, in
2011
as
compared
2010
. The decrease in
2012
and
2011
was primarily due to a reduction in shared administrative and employee related costs required to
support the Wireline segment as a result of the decline in revenue. Total selling, general and administrative expense as a percentage of net services
revenue was
12%
in
2012
and
2011
and
13%
in
2010.
48