Sprint - Nextel 2012 Annual Report Download - page 206
Download and view the complete annual report
Please find page 206 of the 2012 Sprint - Nextel annual report below. You can navigate through the pages in the report by either clicking on the pages listed below, or by using the keyword search tool below to find specific information within the annual report.-
 1
1 -
2
-
3
-
4
-
5
-
6
-
7
-
8
-
9
-
10
-
11
-
12
-
13
-
14
-
15
-
16
-
17
-
18
-
19
-
20
-
21
-
22
-
23
-
24
-
25
-
26
-
27
-
28
-
29
-
30
-
31
-
32
-
33
-
34
-
35
-
36
-
37
-
38
-
39
-
40
-
41
-
42
-
43
-
44
-
45
-
46
-
47
-
48
-
49
-
50
-
51
-
52
-
53
-
54
-
55
-
56
-
57
-
58
-
59
-
60
-
61
-
62
-
63
-
64
-
65
-
66
-
67
-
68
-
69
-
70
-
71
-
72
-
73
-
74
-
75
-
76
-
77
-
78
-
79
-
80
-
81
-
82
-
83
-
84
-
85
-
86
-
87
-
88
-
89
-
90
-
91
-
92
-
93
-
94
-
95
-
96
-
97
-
98
-
99
-
100
-
101
-
102
-
103
-
104
-
105
-
106
-
107
-
108
-
109
-
110
-
111
-
112
-
113
-
114
-
115
-
116
-
117
-
118
-
119
-
120
-
121
-
122
-
123
-
124
-
125
-
126
-
127
-
128
-
129
-
130
-
131
-
132
-
133
-
134
-
135
-
136
-
137
-
138
-
139
-
140
-
141
-
142
-
143
-
144
-
145
-
146
-
147
-
148
-
149
-
150
-
151
-
152
-
153
-
154
-
155
-
156
-
157
-
158
-
159
-
160
-
161
-
162
-
163
-
164
-
165
-
166
-
167
-
168
-
169
-
170
-
171
-
172
-
173
-
174
-
175
-
176
-
177
-
178
-
179
-
180
-
181
-
182
-
183
-
184
-
185
-
186
-
187
-
188
-
189
-
190
-
191
-
192
-
193
-
194
-
195
-
 196
196 -
 197
197 -
 198
198 -
 199
199 -
 200
200 -
 201
201 -
 202
202 -
 203
203 -
 204
204 -
 205
205 -
 206
206 -
 207
207 -
 208
208 -
 209
209 -
 210
210 -
 211
211 -
 212
212 -
 213
213 -
 214
214 -
 215
215 -
 216
216 -
217
-
218
-
219
-
220
-
221
-
222
-
223
-
224
-
225
-
226
-
227
-
228
-
229
-
230
-
231
-
232
-
233
-
234
-
235
-
236
-
237
-
238
-
239
-
240
-
241
-
242
-
243
-
244
-
245
-
246
-
247
-
248
-
249
-
250
-
251
-
252
-
253
-
254
-
255
-
256
-
257
-
258
-
259
-
260
-
261
-
262
-
263
-
264
-
265
-
266
-
267
-
268
-
269
-
270
-
271
-
272
-
273
-
274
-
275
-
276
-
277
-
278
-
279
-
280
-
281
-
282
-
283
-
284
-
285
-
286
-
287
 |
 |

Table of Contents
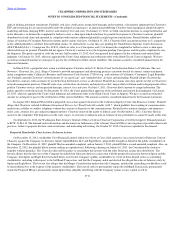
CLEARWIRE CORPORATION AND SUBSIDIARIES
NOTES TO CONSOLIDATED FINANCIAL STATEMENTS
-
(Continued)
Net loss per share attributable to holders of Class A Common Stock on a diluted basis, assuming conversion of the Class B Common Interests
and Class B Common Stock and, where applicable, conversion of the Exchangeable Notes, is calculated based on the following information (in
thousands, except per share amounts):
The diluted weighted average shares did not include the effects of the following potential common shares as their inclusion would have been
antidilutive (in thousands):
We have calculated and presented basic and diluted net loss per share of Class A Common Stock. Class B Common Stock net loss per share is
not calculated since it does not contractually participate in distributions of Clearwire.
F
-
84
Year Ended December 31,
2012
2011
2010
Net loss from continuing operations attributable to Class A Common Stockholders
$
(561,562
)
$
(696,902
)
$
(475,362
)
Non
-
controlling interests in net loss from continuing operations of consolidated
subsidiaries
(1,182,183
)
(2,158,831
)
(1,775,840
)
Tax adjustment resulting from dissolution of Clearwire Communications
(27,611
)
(27,945
)
(27,117
)
Reversal of gain on Exchange Options and Exchangeable Notes interest expense, upon
exchange of notes
—
—
(
58,296
)
Net loss from continuing operations available to Class A Common Stockholders,
assuming the exchange of Class B to Class A Common Stock and conversion of the
Exchangeable Notes
(1,771,356
)
(2,883,678
)
(2,336,615
)
Net loss from discontinued operations available to Class A Common Stockholders
(167,005
)
(20,431
)
(12,075
)
Non
-
controlling interest in net loss from discontinued operations of consolidated
subsidiaries
(1,356
)
(61,379
)
(39,817
)
Net loss from discontinued operations available to Class A Common Stockholders,
assuming the exchange of Class B to Class A Common Stock
(168,361
)
(81,810
)
(51,892
)
Net loss available to Class A Common Stockholders, assuming the exchange of Class B
to Class A Common Stock and conversion of the Exchangeable Notes
$
(1,939,717
)
$
(2,965,488
)
$
(2,388,507
)
Weighted average shares Class A Common Stock outstanding
554,015
257,967
222,527
Weighted average shares converted from Class B Common Stock outstanding
844,588
707,132
741,962
Weighted average shares converted from the Exchangeable Notes
—
—
6,276
Total weighted average shares Class A Common Stock outstanding (diluted)
1,398,603
965,099
970,765
Net loss per share from continuing operations
$
(1.27
)
$
(2.99
)
$
(2.41
)
Net loss per share from discontinued operations
(0.12
)
(0.08
)
(0.05
)
Net loss per share
$
(1.39
)
$
(3.07
)
$
(2.46
)
Year Ended December 31,
2012
2011
2010
Exchangeable Notes conversion shares
91,733
103,001
—
Stock options
4,214
8,920
18,380
Restricted stock units
26,905
13,820
12,414
Warrants
647
7,748
17,806
Subscription rights
—
—
22,657
Contingent shares
—
—
1,519
123,499
133,489
72,776