Sprint - Nextel 2012 Annual Report Download - page 43
Download and view the complete annual report
Please find page 43 of the 2012 Sprint - Nextel annual report below. You can navigate through the pages in the report by either clicking on the pages listed below, or by using the keyword search tool below to find specific information within the annual report.-
 1
1 -
2
-
3
-
4
-
5
-
6
-
7
-
8
-
9
-
10
-
11
-
12
-
13
-
14
-
15
-
16
-
17
-
18
-
19
-
20
-
21
-
22
-
23
-
24
-
25
-
26
-
27
-
28
-
29
-
30
-
31
-
32
-
 33
33 -
 34
34 -
 35
35 -
 36
36 -
 37
37 -
 38
38 -
 39
39 -
 40
40 -
 41
41 -
 42
42 -
 43
43 -
 44
44 -
 45
45 -
 46
46 -
 47
47 -
 48
48 -
 49
49 -
 50
50 -
 51
51 -
 52
52 -
 53
53 -
54
-
55
-
56
-
57
-
58
-
59
-
60
-
61
-
62
-
63
-
64
-
65
-
66
-
67
-
68
-
69
-
70
-
71
-
72
-
73
-
74
-
75
-
76
-
77
-
78
-
79
-
80
-
81
-
82
-
83
-
84
-
85
-
86
-
87
-
88
-
89
-
90
-
91
-
92
-
93
-
94
-
95
-
96
-
97
-
98
-
99
-
100
-
101
-
102
-
103
-
104
-
105
-
106
-
107
-
108
-
109
-
110
-
111
-
112
-
113
-
114
-
115
-
116
-
117
-
118
-
119
-
120
-
121
-
122
-
123
-
124
-
125
-
126
-
127
-
128
-
129
-
130
-
131
-
132
-
133
-
134
-
135
-
136
-
137
-
138
-
139
-
140
-
141
-
142
-
143
-
144
-
145
-
146
-
147
-
148
-
149
-
150
-
151
-
152
-
153
-
154
-
155
-
156
-
157
-
158
-
159
-
160
-
161
-
162
-
163
-
164
-
165
-
166
-
167
-
168
-
169
-
170
-
171
-
172
-
173
-
174
-
175
-
176
-
177
-
178
-
179
-
180
-
181
-
182
-
183
-
184
-
185
-
186
-
187
-
188
-
189
-
190
-
191
-
192
-
193
-
194
-
195
-
196
-
197
-
198
-
199
-
200
-
201
-
202
-
203
-
204
-
205
-
206
-
207
-
208
-
209
-
210
-
211
-
212
-
213
-
214
-
215
-
216
-
217
-
218
-
219
-
220
-
221
-
222
-
223
-
224
-
225
-
226
-
227
-
228
-
229
-
230
-
231
-
232
-
233
-
234
-
235
-
236
-
237
-
238
-
239
-
240
-
241
-
242
-
243
-
244
-
245
-
246
-
247
-
248
-
249
-
250
-
251
-
252
-
253
-
254
-
255
-
256
-
257
-
258
-
259
-
260
-
261
-
262
-
263
-
264
-
265
-
266
-
267
-
268
-
269
-
270
-
271
-
272
-
273
-
274
-
275
-
276
-
277
-
278
-
279
-
280
-
281
-
282
-
283
-
284
-
285
-
286
-
287
 |
 |

Table of Contents
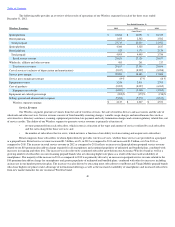
The following table provides an overview of the results of operations of our Wireless segment for each of the three years ended
December 31, 2012
.
Service Revenue
Our Wireless segment generates revenues from the sale of wireless services, the sale of wireless devices and accessories and the sale of
wholesale and other services. Service revenue consists of fixed monthly recurring charges, variable usage charges and miscellaneous fees such as
activation fees, directory assistance, roaming, equipment protection, late payment and early termination charges and certain regulatory related fees, net
of service credits. The ability of our Wireless segment to generate service revenues is primarily a function of:
Retail comprises those subscribers to whom Sprint directly provides wireless services, whether those services are provided on a postpaid
or a prepaid basis. Retail service revenue increased
$1.5 billion
, or 6%
, in
2012
as compared to
2011
and increased
$1.5 billion
, or 6% in
2011
as
compared to
2010
. The increase in retail service revenue in
2012
as compared to
2011
reflects an increase in Sprint platform postpaid service revenue
related to our $10 premium data add
-
on charge required for all smartphones and continued popularity of unlimited and bundled plans, combined with
increases in roaming and other fees. The increase was also driven by continued subscriber growth from our Assurance Wireless brand as well as a
growing number of subscribers on our remaining prepaid brands who are choosing higher rate plans as a result of the increased availability of
smartphones. The majority of the increase in
2011
as compared to
2010
was primarily driven by an increase in postpaid service revenue related to the
$10 premium data add
-
on charge for smartphones and greater popularity of unlimited and bundled plans, combined with other fee increases including
an increase in our handset protection plan. The increase was also driven by attracting more subscribers to our Boost and Virgin Mobile prepaid brands
who chose higher rate plans to take advantage of international offerings as well as the increased availability of smartphones and increased subscribers
from new market launches for our Assurance Wireless brand.
40
Year Ended December 31,
Wireless Earnings
2012
2011
2010
(in millions)
Sprint platform
$
22,264
$
20,052
$
18,339
Nextel platform
1,455
2,582
3,582
Total postpaid
23,719
22,634
21,921
Sprint platform
4,380
3,325
1,617
Nextel platform
525
1,170
2,139
Total prepaid
4,905
4,495
3,756
Retail service revenue
28,624
27,129
25,677
Wholesale, affiliate and other revenue
483
261
217
Total service revenue
29,107
27,390
25,894
Cost of services (exclusive of depreciation and amortization)
(9,017
)
(8,907
)
(8,288
)
Service gross margin
20,090
18,483
17,606
Service gross margin percentage
69
%
67
%
68
%
Equipment revenue
3,248
2,911
2,703
Cost of products
(9,905
)
(8,057
)
(6,965
)
Equipment net subsidy
(6,657
)
(5,146
)
(4,262
)
Equipment net subsidy percentage
(205
)%
(177
)%
(158
)%
Selling, general and administrative expense
(9,286
)
(9,070
)
(8,813
)
Wireless segment earnings
$
4,147
$
4,267
$
4,531
•
revenue generated from each subscriber, which in turn is a function of the types and amount of services utilized by each subscriber
and the rates charged for those services; and
•
the number of subscribers that we serve, which in turn is a function of our ability to retain existing and acquire new subscribers.