Sprint - Nextel 2012 Annual Report Download - page 201
Download and view the complete annual report
Please find page 201 of the 2012 Sprint - Nextel annual report below. You can navigate through the pages in the report by either clicking on the pages listed below, or by using the keyword search tool below to find specific information within the annual report.-
 1
1 -
2
-
3
-
4
-
5
-
6
-
7
-
8
-
9
-
10
-
11
-
12
-
13
-
14
-
15
-
16
-
17
-
18
-
19
-
20
-
21
-
22
-
23
-
24
-
25
-
26
-
27
-
28
-
29
-
30
-
31
-
32
-
33
-
34
-
35
-
36
-
37
-
38
-
39
-
40
-
41
-
42
-
43
-
44
-
45
-
46
-
47
-
48
-
49
-
50
-
51
-
52
-
53
-
54
-
55
-
56
-
57
-
58
-
59
-
60
-
61
-
62
-
63
-
64
-
65
-
66
-
67
-
68
-
69
-
70
-
71
-
72
-
73
-
74
-
75
-
76
-
77
-
78
-
79
-
80
-
81
-
82
-
83
-
84
-
85
-
86
-
87
-
88
-
89
-
90
-
91
-
92
-
93
-
94
-
95
-
96
-
97
-
98
-
99
-
100
-
101
-
102
-
103
-
104
-
105
-
106
-
107
-
108
-
109
-
110
-
111
-
112
-
113
-
114
-
115
-
116
-
117
-
118
-
119
-
120
-
121
-
122
-
123
-
124
-
125
-
126
-
127
-
128
-
129
-
130
-
131
-
132
-
133
-
134
-
135
-
136
-
137
-
138
-
139
-
140
-
141
-
142
-
143
-
144
-
145
-
146
-
147
-
148
-
149
-
150
-
151
-
152
-
153
-
154
-
155
-
156
-
157
-
158
-
159
-
160
-
161
-
162
-
163
-
164
-
165
-
166
-
167
-
168
-
169
-
170
-
171
-
172
-
173
-
174
-
175
-
176
-
177
-
178
-
179
-
180
-
181
-
182
-
183
-
184
-
185
-
186
-
187
-
188
-
189
-
190
-
 191
191 -
 192
192 -
 193
193 -
 194
194 -
 195
195 -
 196
196 -
 197
197 -
 198
198 -
 199
199 -
 200
200 -
 201
201 -
 202
202 -
 203
203 -
 204
204 -
 205
205 -
 206
206 -
 207
207 -
 208
208 -
 209
209 -
 210
210 -
 211
211 -
212
-
213
-
214
-
215
-
216
-
217
-
218
-
219
-
220
-
221
-
222
-
223
-
224
-
225
-
226
-
227
-
228
-
229
-
230
-
231
-
232
-
233
-
234
-
235
-
236
-
237
-
238
-
239
-
240
-
241
-
242
-
243
-
244
-
245
-
246
-
247
-
248
-
249
-
250
-
251
-
252
-
253
-
254
-
255
-
256
-
257
-
258
-
259
-
260
-
261
-
262
-
263
-
264
-
265
-
266
-
267
-
268
-
269
-
270
-
271
-
272
-
273
-
274
-
275
-
276
-
277
-
278
-
279
-
280
-
281
-
282
-
283
-
284
-
285
-
286
-
287
 |
 |

Table of Contents
CLEARWIRE CORPORATION AND SUBSIDIARIES
NOTES TO CONSOLIDATED FINANCIAL STATEMENTS
-
(Continued)
The fair value of each option grant is estimated on the date of grant using the Black
-
Scholes option pricing model using the following
assumptions for the years ended December 31, 2010:
The fair value of option grants in 2010 was $4.3 million. There were no options granted in 2012 and 2011. The total fair value of options vested
during the years ended December 31, 2012, 2011 and 2010 was $0.7 million, $6.6 million and $9.8 million, respectively. The total unrecognized share
-
based compensation costs related to non
-
vested stock options outstanding at December 31, 2012 was approximately $0.1 million and is expected to be
recognized over a weighted average period of approximately four months.
Share
-
based compensation expense is based on the estimated grant
-
date fair value of the award and is recognized net of estimated forfeitures on
those shares expected to vest, over a graded vesting schedule on a straight
-
line basis over the requisite service period for each separately vesting
portion of the award as if the award was, in
-
substance, multiple awards. Share
-
based compensation expense recognized for all plans for the years
ended December 31, 2012, 2011 and 2010 is as follows (in thousands):
During the years ended December 31, 2012, 2011 and 2010 we reversed $3.4 million, $23.9 million, and $9.8 million, respectively, of share
-
based
compensation expense related to the forfeiture of RSUs and options that had been recognized but not yet earned. During the year ended December 31,
2012 we had no additional share
-
based compensation expense related to the acceleration of vesting or the extension of the exercise period for certain
RSUs and options. During the years ended December 31, 2011 and 2010, we recorded $3.7 million and $10.9 million, respectively, of additional share
-
based compensation expense related to the acceleration of vesting and the extension of the exercise period for certain RSUs and options.
Class A Common Stock
The Class A Common Stock represents the common equity of Clearwire. The holders of the Class A Common Stock are entitled to one vote per
share and, as a class, are entitled to
100%
of any dividends or distributions made by Clearwire, with the exception of certain minimal liquidation rights
provided to the Class B Common Stockholders, which are described below. Each share of Class A Common Stock participates ratably in proportion to
the total number of shares of Class A Common Stock issued by Clearwire. Holders of Class A Common Stock have
100%
of the economic interest in
Clearwire and are considered the controlling interest for the purposes of financial reporting.
Upon liquidation, dissolution or winding up, the Class A Common Stock will be entitled to any assets remaining after payment of all debts and
liabilities of Clearwire, with the exception of certain minimal liquidation rights provided to the Class B Common Stockholders, which are described
below.
F
-
79
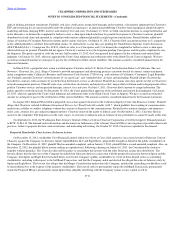
Year Ended
December 31,
2010
Expected volatility
58.80%
-
62.22%
Expected dividend yield
—
Expected life (in years)
6.25
Risk
-
free interest rate
2.00%
-
3.15%
Weighted average fair value per option at grant date
$4.27
Year Ended December 31.
2012
2011
2010
Options
$
250
$
1,016
$
16,749
RSUs
28,616
25,535
30,582
Sprint Equity Compensation Plans
—
73
204
Total
$
28,866
$
26,624
$
47,535
15.
Stockholders
’
Equity