Sprint - Nextel 2012 Annual Report Download - page 40
Download and view the complete annual report
Please find page 40 of the 2012 Sprint - Nextel annual report below. You can navigate through the pages in the report by either clicking on the pages listed below, or by using the keyword search tool below to find specific information within the annual report.-
 1
1 -
2
-
3
-
4
-
5
-
6
-
7
-
8
-
9
-
10
-
11
-
12
-
13
-
14
-
15
-
16
-
17
-
18
-
19
-
20
-
21
-
22
-
23
-
24
-
25
-
26
-
27
-
28
-
29
-
 30
30 -
 31
31 -
 32
32 -
 33
33 -
 34
34 -
 35
35 -
 36
36 -
 37
37 -
 38
38 -
 39
39 -
 40
40 -
 41
41 -
 42
42 -
 43
43 -
 44
44 -
 45
45 -
 46
46 -
 47
47 -
 48
48 -
 49
49 -
 50
50 -
51
-
52
-
53
-
54
-
55
-
56
-
57
-
58
-
59
-
60
-
61
-
62
-
63
-
64
-
65
-
66
-
67
-
68
-
69
-
70
-
71
-
72
-
73
-
74
-
75
-
76
-
77
-
78
-
79
-
80
-
81
-
82
-
83
-
84
-
85
-
86
-
87
-
88
-
89
-
90
-
91
-
92
-
93
-
94
-
95
-
96
-
97
-
98
-
99
-
100
-
101
-
102
-
103
-
104
-
105
-
106
-
107
-
108
-
109
-
110
-
111
-
112
-
113
-
114
-
115
-
116
-
117
-
118
-
119
-
120
-
121
-
122
-
123
-
124
-
125
-
126
-
127
-
128
-
129
-
130
-
131
-
132
-
133
-
134
-
135
-
136
-
137
-
138
-
139
-
140
-
141
-
142
-
143
-
144
-
145
-
146
-
147
-
148
-
149
-
150
-
151
-
152
-
153
-
154
-
155
-
156
-
157
-
158
-
159
-
160
-
161
-
162
-
163
-
164
-
165
-
166
-
167
-
168
-
169
-
170
-
171
-
172
-
173
-
174
-
175
-
176
-
177
-
178
-
179
-
180
-
181
-
182
-
183
-
184
-
185
-
186
-
187
-
188
-
189
-
190
-
191
-
192
-
193
-
194
-
195
-
196
-
197
-
198
-
199
-
200
-
201
-
202
-
203
-
204
-
205
-
206
-
207
-
208
-
209
-
210
-
211
-
212
-
213
-
214
-
215
-
216
-
217
-
218
-
219
-
220
-
221
-
222
-
223
-
224
-
225
-
226
-
227
-
228
-
229
-
230
-
231
-
232
-
233
-
234
-
235
-
236
-
237
-
238
-
239
-
240
-
241
-
242
-
243
-
244
-
245
-
246
-
247
-
248
-
249
-
250
-
251
-
252
-
253
-
254
-
255
-
256
-
257
-
258
-
259
-
260
-
261
-
262
-
263
-
264
-
265
-
266
-
267
-
268
-
269
-
270
-
271
-
272
-
273
-
274
-
275
-
276
-
277
-
278
-
279
-
280
-
281
-
282
-
283
-
284
-
285
-
286
-
287
 |
 |

Table of Contents
decline in 2013, we expect an increase in capital expenditures during the period of implementation of Network Vision, which is expected to result in an
increase in depreciation expense over the next several years as those assets are placed in service. Depreciation expense decreased
$619 million
, or
12%
,
in
2011
compared to
2010
primarily due to the estimated useful life study of depreciable assets which reflected a reduction in the replacement rate of
capital additions. This decline is partially offset by an increase due to assets placed in service as a result of capital expenditures related to capacity to
support increased data usage by our subscribers.
Amortization expense declined
$100 million
, or
25%
, in
2012
compared to
2011
primarily due to the absence of amortization for customer
relationship intangible assets related to the 2006 acquisition of Nextel Partners, Inc. and the 2009 acquisition of Virgin Mobile USA, Inc. (Virgin
Mobile), which became fully amortized in the second quarter 2011. Amortization expense declined
$771 million
, or
66%
, in
2011
as compared to
2010,
primarily due to the absence of amortization for customer relationship intangible assets related to the 2005 acquisition of Nextel which became fully
amortized in the second quarter 2010 and Nextel Partners, Inc. and Virgin Mobile impacting 2011 as discussed above. Our remaining customer
relationships are amortized using the sum
-
of
-
the
-
months'
-
digits method, resulting in higher amortization rates in early periods that decline over time.
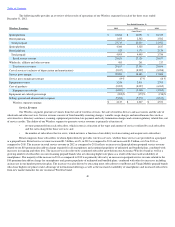
Other, net
The following table provides additional information of items included in “Other, net” for the years ended
December 31, 2012
, 2011
and
2010.
Other, net changed
$26 million
, or
25%
, in
2012
compared to
2011
and
$126 million
, or
630%
, in
2011
compared to
2010
. During
2012
, we
recognized severance and exit costs of
$196 million
as a result of lease exit costs associated with taking certain Nextel platform sites off
-
air in the
second and third quarter 2012. We did not accrue lease exit costs for certain sites taken off
-
air in the second and third quarter of 2012 as these sites are
subject to agreements under which we expect to continue to receive economic benefit for the remaining term. As a result of this factor, as well as the
variability of factors that are used in the estimate of lease exit costs, the relationship of the costs recognized in the current quarter to the number of
sites taken off
-
air is not necessarily indicative of future per
-
site charges as we complete our transition of Nextel customers and continue to take sites
off
-
air. During 2011 we recognized severance and exit costs of
$28 million
associated with actions in the fourth quarter of 2011. During 2010 we
recognized
$8 million
of severance and exit costs primarily related to exit costs incurred in the second and fourth quarter 2010 associated with vacating
certain office space which is no longer being utilized. Asset impairments increased by
$24 million
, or
31%
, in
2012
compared to
2011
and decreased
$47
million
, or
38%
, in
2011
compared to
2010.
Asset impairments in the first quarter 2012, consisted of
$18 million
of assets associated with a decision to utilize fiber backhaul, which we
expect to be more cost effective, rather than microwave backhaul and
$66 million
of capitalized assets that we no longer intend to deploy as a result of
the termination of a spectrum hosting arrangement in the first quarter 2012. Asset impairments of
$18 million
in the fourth quarter 2012 and all asset
impairments in 2011 and 2010 primarily relate to assets that are no longer necessary for management's strategic plans and were primarily related to
network asset equipment.
Spectrum hosting contract termination is due to the recognition of
$236 million
of the total
$310 million
paid by LightSquared in 2011 as
operating income in "Other, net" due to the termination of our spectrum hosting arrangement with LightSquared. Additional information related to
these items can be found in the Notes to the
37
Year Ended December 31,
2012
2011
2010
(in millions)
Severance and exit costs
$
(196
)
$
(28
)
$
(8
)
Asset impairments
(102
)
(78
)
(125
)
Spectrum hosting contract termination
236
—
—
Gains from asset dispositions and exchanges
29
—
69
Other
(47
)
—
84
Total
$
(80
)
$
(106
)
$
20