Sprint - Nextel 2012 Annual Report Download - page 44
Download and view the complete annual report
Please find page 44 of the 2012 Sprint - Nextel annual report below. You can navigate through the pages in the report by either clicking on the pages listed below, or by using the keyword search tool below to find specific information within the annual report.-
 1
1 -
2
-
3
-
4
-
5
-
6
-
7
-
8
-
9
-
10
-
11
-
12
-
13
-
14
-
15
-
16
-
17
-
18
-
19
-
20
-
21
-
22
-
23
-
24
-
25
-
26
-
27
-
28
-
29
-
30
-
31
-
32
-
33
-
 34
34 -
 35
35 -
 36
36 -
 37
37 -
 38
38 -
 39
39 -
 40
40 -
 41
41 -
 42
42 -
 43
43 -
 44
44 -
 45
45 -
 46
46 -
 47
47 -
 48
48 -
 49
49 -
 50
50 -
 51
51 -
 52
52 -
 53
53 -
 54
54 -
55
-
56
-
57
-
58
-
59
-
60
-
61
-
62
-
63
-
64
-
65
-
66
-
67
-
68
-
69
-
70
-
71
-
72
-
73
-
74
-
75
-
76
-
77
-
78
-
79
-
80
-
81
-
82
-
83
-
84
-
85
-
86
-
87
-
88
-
89
-
90
-
91
-
92
-
93
-
94
-
95
-
96
-
97
-
98
-
99
-
100
-
101
-
102
-
103
-
104
-
105
-
106
-
107
-
108
-
109
-
110
-
111
-
112
-
113
-
114
-
115
-
116
-
117
-
118
-
119
-
120
-
121
-
122
-
123
-
124
-
125
-
126
-
127
-
128
-
129
-
130
-
131
-
132
-
133
-
134
-
135
-
136
-
137
-
138
-
139
-
140
-
141
-
142
-
143
-
144
-
145
-
146
-
147
-
148
-
149
-
150
-
151
-
152
-
153
-
154
-
155
-
156
-
157
-
158
-
159
-
160
-
161
-
162
-
163
-
164
-
165
-
166
-
167
-
168
-
169
-
170
-
171
-
172
-
173
-
174
-
175
-
176
-
177
-
178
-
179
-
180
-
181
-
182
-
183
-
184
-
185
-
186
-
187
-
188
-
189
-
190
-
191
-
192
-
193
-
194
-
195
-
196
-
197
-
198
-
199
-
200
-
201
-
202
-
203
-
204
-
205
-
206
-
207
-
208
-
209
-
210
-
211
-
212
-
213
-
214
-
215
-
216
-
217
-
218
-
219
-
220
-
221
-
222
-
223
-
224
-
225
-
226
-
227
-
228
-
229
-
230
-
231
-
232
-
233
-
234
-
235
-
236
-
237
-
238
-
239
-
240
-
241
-
242
-
243
-
244
-
245
-
246
-
247
-
248
-
249
-
250
-
251
-
252
-
253
-
254
-
255
-
256
-
257
-
258
-
259
-
260
-
261
-
262
-
263
-
264
-
265
-
266
-
267
-
268
-
269
-
270
-
271
-
272
-
273
-
274
-
275
-
276
-
277
-
278
-
279
-
280
-
281
-
282
-
283
-
284
-
285
-
286
-
287
 |
 |

Table of Contents
Wholesale and affiliates are those subscribers who are served through MVNO and affiliate relationships and other arrangements through
which wireless services are sold by Sprint to other companies that resell those services to subscribers. Wholesale, affiliate and other revenues
increased
$222 million
, or
85%
, for
2012
as compared to
2011
, and increased
$44 million
, or
20%
, for
2011
as compared to
2010
. The majority of the
increase in
2012
as compared to
2011
and
2011
as compared to
2010
was a result of growth in our MVNO's reselling prepaid services. Specifically,
growth in subscribers on the Lifeline program offered through our MVNO's reselling prepaid services, which is similar to our Assurance Wireless
offering, contributed to revenue growth. Approximately
33%
of our wholesale and affiliate subscribers represent a growing number of connected
devices. These devices generate revenue from usage which varies depending on the solution being utilized. Average revenue per connected device is
generally significantly lower than revenue from other wholesale and affiliate subscribers; however, the cost to service these customers is also lower
resulting in a higher profit margin as a percent of revenue.
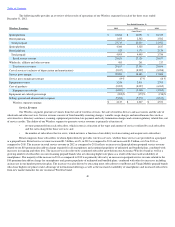
Average Monthly Service Revenue per Subscriber and Subscriber Trends
The table below summarizes average number of retail subscribers and ARPU for the years ended
December 31, 2012
, 2011
and
2010.
Additional information about the number of subscribers, net additions to subscribers, ARPU, and average rates of monthly postpaid and prepaid
subscriber churn for each quarter since the first quarter
2010
may be found in the tables on the following pages.
___________________
Postpaid ARPU for
2012
increased as compared to
2011
primarily due to increased revenues from the $10 premium data add
-
on charges for
all smartphones and increases in roaming and other fees. Postpaid ARPU for
2011
increased as compared to
2010
due to increased revenues from the
$10 premium data add
-
on charges for all smartphones and fee increases in our handset protection plan.
Prepaid ARPU declined for
2012
compared to
2011
and for
2011
compared to
2010
primarily as a result of net additions of our Assurance
Wireless brand whose subscribers carry a lower ARPU, partially offset by an increase in ARPU for the remaining prepaid brands as subscribers are
choosing higher priced plans to take advantage of international offerings and the increased availability of smartphones. Average retail ARPU
increased for
2012
compared to
2011
primarily as a result of the increased postpaid ARPU which was partially offset by an increased weighting of
average prepaid subscribers to average retail subscribers which carry a lower ARPU. Average retail ARPU increased for
2011
compared to
2010
primarily as a result of the increased postpaid ARPU which was partially offset by an increased weighting of average prepaid subscribers to total
subscribers which carry a lower ARPU.
41
Year Ended December 31,
2012
2011
2010
(subscribers in thousands)
Average postpaid subscribers
32,462
32,935
33,249
Average prepaid subscribers
15,291
13,672
11,272
Average retail subscribers
47,753
46,607
44,521
ARPU(1)
:
Postpaid
$
60.84
$
57.27
$
54.94
Prepaid
$
26.72
$
27.40
$
27.76
Average retail
$
49.92
$
48.51
$
48.06
(1)
ARPU is calculated by dividing service revenue by the sum of the average number of subscribers in the applicable service category. Changes in average monthly service
revenue reflect subscribers for either the postpaid or prepaid service category who change rate plans, the level of voice and data usage, the amount of service credits
which are offered to subscribers, plus the net effect of average monthly revenue generated by new subscribers and deactivating subscribers.