Sprint - Nextel 2014 Annual Report Download - page 107
Download and view the complete annual report
Please find page 107 of the 2014 Sprint - Nextel annual report below. You can navigate through the pages in the report by either clicking on the pages listed below, or by using the keyword search tool below to find specific information within the annual report.-
 1
1 -
2
-
3
-
4
-
5
-
6
-
7
-
8
-
9
-
10
-
11
-
12
-
13
-
14
-
15
-
16
-
17
-
18
-
19
-
20
-
21
-
22
-
23
-
24
-
25
-
26
-
27
-
28
-
29
-
30
-
31
-
32
-
33
-
34
-
35
-
36
-
37
-
38
-
39
-
40
-
41
-
42
-
43
-
44
-
45
-
46
-
47
-
48
-
49
-
50
-
51
-
52
-
53
-
54
-
55
-
56
-
57
-
58
-
59
-
60
-
61
-
62
-
63
-
64
-
65
-
66
-
67
-
68
-
69
-
70
-
71
-
72
-
73
-
74
-
75
-
76
-
77
-
78
-
79
-
80
-
81
-
82
-
83
-
84
-
85
-
86
-
87
-
88
-
89
-
90
-
91
-
92
-
93
-
94
-
95
-
96
-
 97
97 -
 98
98 -
 99
99 -
 100
100 -
 101
101 -
 102
102 -
 103
103 -
 104
104 -
 105
105 -
 106
106 -
 107
107 -
 108
108 -
 109
109 -
 110
110 -
 111
111 -
 112
112 -
 113
113 -
 114
114 -
 115
115 -
 116
116 -
 117
117 -
118
-
119
-
120
-
121
-
122
-
123
-
124
-
125
-
126
-
127
-
128
-
129
-
130
-
131
-
132
-
133
-
134
-
135
-
136
-
137
-
138
-
139
-
140
-
141
-
142
-
143
-
144
-
145
-
146
-
147
-
148
-
149
-
150
-
151
-
152
-
153
-
154
-
155
-
156
-
157
-
158
-
159
-
160
-
161
-
162
-
163
-
164
-
165
-
166
-
167
-
168
-
169
-
170
-
171
-
172
-
173
-
174
-
175
-
176
-
177
-
178
-
179
-
180
-
181
-
182
-
183
-
184
-
185
-
186
-
187
-
188
-
189
-
190
-
191
-
192
-
193
-
194
 |
 |
Table of Contents
Index to Consolidated Financial Statements
SPRINT CORPORATION
NOTES TO THE CONSOLIDATED FINANCIAL STATEMENTS
F-24
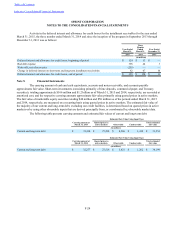
Activity in the deferred interest and allowance for credit losses for the installment receivables for the year ended
March 31, 2015, the three months ended March 31, 2014 and since the inception of the program in September 2013 through
December 31, 2013 was as follows:
Year Ended
March 31,
Three
Months
Ended
March 31, Year Ended
December 31,
2015 2014 2013
(in millions)
Deferred interest and allowance for credit losses, beginning of period $ 124 $ 13 $ —
Bad debt expense 398 44 3
Write-offs, net of recoveries (255) — —
Change in deferred interest on short-term and long-term installment receivables 62 67 10
Deferred interest and allowance for credit losses, end of period $ 329 $ 124 $ 13
Note 5. Financial Instruments
The carrying amount of cash and cash equivalents, accounts and notes receivable, and accounts payable
approximates fair value. Short-term investments (consisting primarily of time deposits, commercial paper, and Treasury
securities), totaling approximately $166 million and $1.2 billion as of March 31, 2015 and 2014, respectively, are recorded at
amortized cost, and the respective carrying amounts approximate fair value primarily using quoted prices in active markets.
The fair value of marketable equity securities totaling $40 million and $50 million as of the periods ended March 31, 2015
and 2014, respectively, are measured on a recurring basis using quoted prices in active markets. The estimated fair value of
the majority of our current and long-term debt, excluding our credit facilities, is determined based on quoted prices in active
markets or by using other observable inputs that are derived principally from, or corroborated by, observable market data.
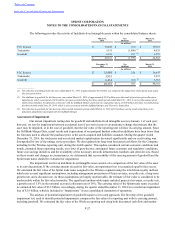
The following table presents carrying amounts and estimated fair values of current and long-term debt:
Carrying amount at
March 31, 2015
Estimated Fair Value Using Input Type
Quoted prices in
active markets Observable Unobservable Total estimated
fair value
(in millions)
Current and long-term debt $ 33,434 $ 27,238 $ 4,906 $ 1,410 $ 33,554
Carrying amount at
March 31, 2014
Estimated Fair Value Using Input Type
Quoted prices in
active markets Observable Unobservable Total estimated
fair value
(in millions)
Current and long-term debt $ 32,277 $ 27,516 $ 5,421 $ 1,262 $ 34,199