Sprint - Nextel 2014 Annual Report Download - page 32
Download and view the complete annual report
Please find page 32 of the 2014 Sprint - Nextel annual report below. You can navigate through the pages in the report by either clicking on the pages listed below, or by using the keyword search tool below to find specific information within the annual report.-
 1
1 -
2
-
3
-
4
-
5
-
6
-
7
-
8
-
9
-
10
-
11
-
12
-
13
-
14
-
15
-
16
-
17
-
18
-
19
-
20
-
21
-
 22
22 -
 23
23 -
 24
24 -
 25
25 -
 26
26 -
 27
27 -
 28
28 -
 29
29 -
 30
30 -
 31
31 -
 32
32 -
 33
33 -
 34
34 -
 35
35 -
 36
36 -
 37
37 -
 38
38 -
 39
39 -
 40
40 -
 41
41 -
 42
42 -
43
-
44
-
45
-
46
-
47
-
48
-
49
-
50
-
51
-
52
-
53
-
54
-
55
-
56
-
57
-
58
-
59
-
60
-
61
-
62
-
63
-
64
-
65
-
66
-
67
-
68
-
69
-
70
-
71
-
72
-
73
-
74
-
75
-
76
-
77
-
78
-
79
-
80
-
81
-
82
-
83
-
84
-
85
-
86
-
87
-
88
-
89
-
90
-
91
-
92
-
93
-
94
-
95
-
96
-
97
-
98
-
99
-
100
-
101
-
102
-
103
-
104
-
105
-
106
-
107
-
108
-
109
-
110
-
111
-
112
-
113
-
114
-
115
-
116
-
117
-
118
-
119
-
120
-
121
-
122
-
123
-
124
-
125
-
126
-
127
-
128
-
129
-
130
-
131
-
132
-
133
-
134
-
135
-
136
-
137
-
138
-
139
-
140
-
141
-
142
-
143
-
144
-
145
-
146
-
147
-
148
-
149
-
150
-
151
-
152
-
153
-
154
-
155
-
156
-
157
-
158
-
159
-
160
-
161
-
162
-
163
-
164
-
165
-
166
-
167
-
168
-
169
-
170
-
171
-
172
-
173
-
174
-
175
-
176
-
177
-
178
-
179
-
180
-
181
-
182
-
183
-
184
-
185
-
186
-
187
-
188
-
189
-
190
-
191
-
192
-
193
-
194
 |
 |

Table of Contents
30
Predecessor 191-Day Period Ended July 10, 2013
Significant changes in the underlying trends affecting the Company's consolidated results of operations and net
loss for the 191 days ended July 10, 2013 were as follows:
• We recorded a gain on previously-held Clearwire equity interests of approximately $2.9 billion for the
difference between the estimated fair value of the equity interests owned prior to the acquisition ($5.00 per
share offer price less an estimated control premium of approximately $0.60) and the carrying value of
approximately $325 million for those previously-held equity interests; and
• Increased income tax expense was primarily attributable to taxable temporary differences as a result of the
$2.9 billion gain on the previously-held equity interests in Clearwire, which was principally attributable to the
increase in the fair value of Federal Communications Commission (FCC) licenses held by Clearwire and from
amortization of FCC licenses. FCC licenses are amortized over 15 years for income tax purposes but, because
these licenses have an indefinite life, they are not amortized for financial statement reporting purposes.
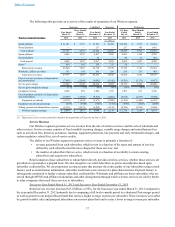
Consolidated Results of Operations
The following table provides an overview of the consolidated results of operations. The Predecessor information
represents the historical basis of presentation for Sprint Communications for all periods prior to the SoftBank Merger. The
Successor period includes the operating activity of Sprint Corporation, which includes the activity and accounts of Starburst
II prior to the close of the SoftBank Merger on July 10, 2013 and Sprint Communications, inclusive of Clearwire
prospectively from the date of the SoftBank Merger on July 10, 2013 through March 31, 2015.
Successor Combined Successor Predecessor
Year Ended
March 31,
Three Months
Ended
March 31, Year Ended
December 31, Year Ended
December 31,
87 Days
Ended
December 31,
191 Days
Ended
July 10,
Three Months
Ended
March 31, Year Ended
December 31,
2015 2014 2013 2013 2013 2012 2013 2013 2012
(in millions)
Wireless segment earnings $ 5,894 $ 1,837 $ — $ 4,948 $ 2,178 $ — $ 2,770 $ 1,395 $ 4,147
Wireline segment earnings 113 12 — 494 222 — 272 128 649
Corporate, other and
eliminations (7) (5) (14) (33) (34) (33) 1 1 7
Consolidated segment
earnings (loss) 6,000 1,844 (14) 5,409 2,366 (33) 3,043 1,524 4,803
Depreciation (3,797) (868) — (5,124) (2,026) — (3,098) (1,422) (6,240)
Amortization (1,552) (429) — (1,055) (908) — (147) (70) (303)
Impairments (2,133) (75) — — — — — — (102)
Other, net (413) (52) — (1,085) (402) — (683) (3) 22
Operating (loss) income (1,895) 420 (14) (1,855) (970) (33) (885) 29 (1,820)
Interest expense (2,051) (516) — (2,053) (918) — (1,135) (432) (1,428)
Equity in losses of
unconsolidated
investments, net — — — (482) — — (482) (202) (1,114)
Gain on previously-held
equity interests — — — 2,926 — — 2,926 — —
Other income (expense),
net 27 1 6 92 73 10 19 — 190
Income tax benefit
(expense) 574 (56) (1) (1,646) (45) (4) (1,601) (38) (154)
Net loss $ (3,345) $ (151) $ (9) $ (3,018) $ (1,860) $ (27) $ (1,158) $ (643) $ (4,326)