Sprint - Nextel 2014 Annual Report Download - page 142
Download and view the complete annual report
Please find page 142 of the 2014 Sprint - Nextel annual report below. You can navigate through the pages in the report by either clicking on the pages listed below, or by using the keyword search tool below to find specific information within the annual report.-
 1
1 -
2
-
3
-
4
-
5
-
6
-
7
-
8
-
9
-
10
-
11
-
12
-
13
-
14
-
15
-
16
-
17
-
18
-
19
-
20
-
21
-
22
-
23
-
24
-
25
-
26
-
27
-
28
-
29
-
30
-
31
-
32
-
33
-
34
-
35
-
36
-
37
-
38
-
39
-
40
-
41
-
42
-
43
-
44
-
45
-
46
-
47
-
48
-
49
-
50
-
51
-
52
-
53
-
54
-
55
-
56
-
57
-
58
-
59
-
60
-
61
-
62
-
63
-
64
-
65
-
66
-
67
-
68
-
69
-
70
-
71
-
72
-
73
-
74
-
75
-
76
-
77
-
78
-
79
-
80
-
81
-
82
-
83
-
84
-
85
-
86
-
87
-
88
-
89
-
90
-
91
-
92
-
93
-
94
-
95
-
96
-
97
-
98
-
99
-
100
-
101
-
102
-
103
-
104
-
105
-
106
-
107
-
108
-
109
-
110
-
111
-
112
-
113
-
114
-
115
-
116
-
117
-
118
-
119
-
120
-
121
-
122
-
123
-
124
-
125
-
126
-
127
-
128
-
129
-
130
-
131
-
 132
132 -
 133
133 -
 134
134 -
 135
135 -
 136
136 -
 137
137 -
 138
138 -
 139
139 -
 140
140 -
 141
141 -
 142
142 -
 143
143 -
 144
144 -
 145
145 -
 146
146 -
 147
147 -
 148
148 -
 149
149 -
 150
150 -
 151
151 -
 152
152 -
153
-
154
-
155
-
156
-
157
-
158
-
159
-
160
-
161
-
162
-
163
-
164
-
165
-
166
-
167
-
168
-
169
-
170
-
171
-
172
-
173
-
174
-
175
-
176
-
177
-
178
-
179
-
180
-
181
-
182
-
183
-
184
-
185
-
186
-
187
-
188
-
189
-
190
-
191
-
192
-
193
-
194
 |
 |
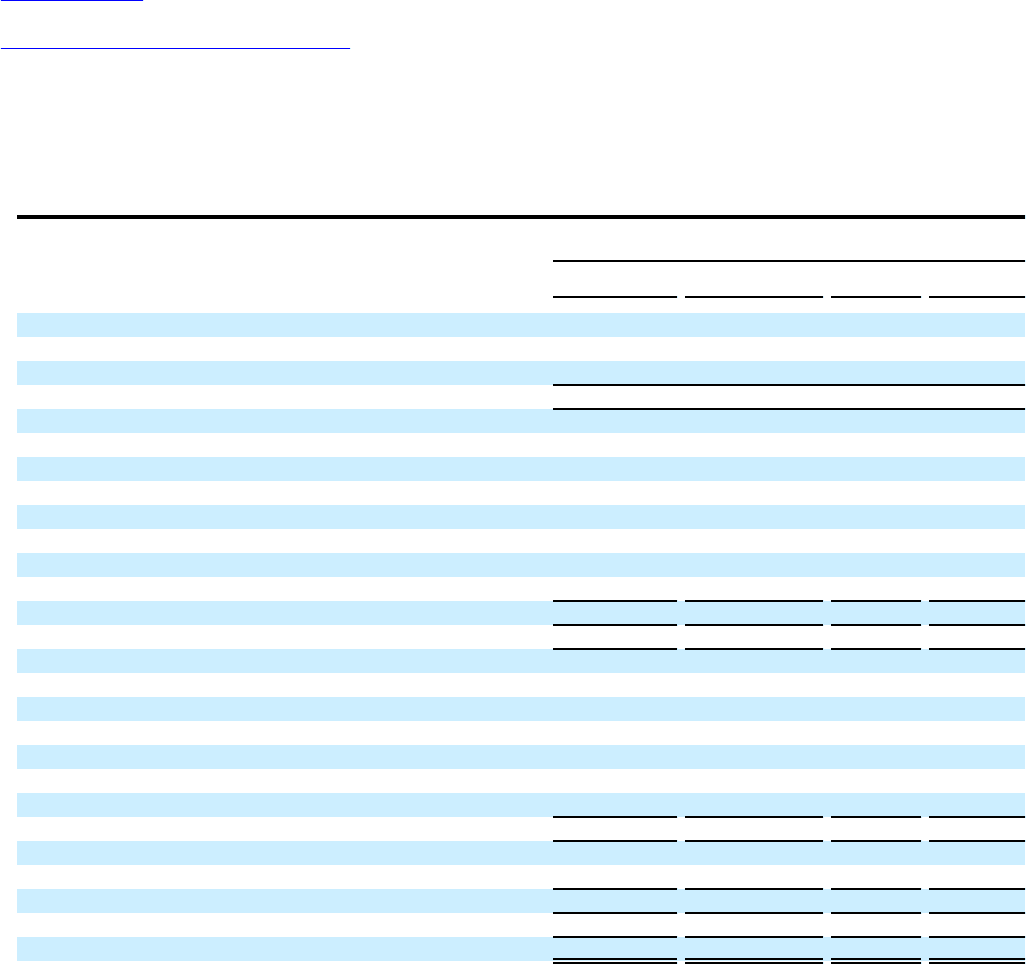
Table of Contents
Index to Consolidated Financial Statements
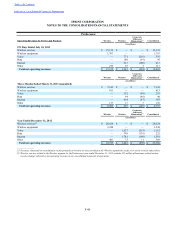
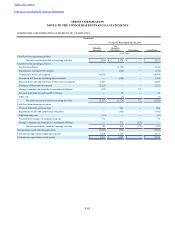
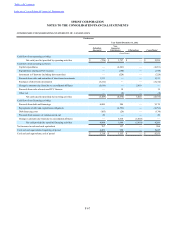
SPRINT CORPORATION
NOTES TO THE CONSOLIDATED FINANCIAL STATEMENTS
F-59
CONDENSED CONSOLIDATING STATEMENT OF COMPREHENSIVE LOSS
Predecessor
For the 191 Days Ended July 10, 2013
Subsidiary
Guarantor Non-Guarantor
Subsidiaries Eliminations Consolidated
(in millions)
Net operating revenues:
Service $ — $ 16,895 $ — $ 16,895
Equipment — 1,707 — 1,707
— 18,602 — 18,602
Net operating expenses:
Cost of services (exclusive of depreciation and amortization below) — 5,673 — 5,673
Cost of products (exclusive of depreciation and amortization below) — 4,872 — 4,872
Selling, general and administrative — 5,067 — 5,067
Severance and exit costs — 652 — 652
Depreciation — 3,098 — 3,098
Amortization — 147 — 147
Other, net — (22) — (22)
— 19,487 — 19,487
Operating loss — (885) — (885)
Other income (expense):
Interest income 61 15 (43) 33
Interest expense (842) (336) 43 (1,135)
Equity in losses of unconsolidated investments, net — (482) — (482)
Gain on previously-held equity interests — 2,926 — 2,926
(Losses) earnings of subsidiaries (365) — 365 —
Other expense, net (12) (2) — (14)
(1,158) 2,121 365 1,328
(Loss) income before income taxes (1,158) 1,236 365 443
Income tax expense — (1,601) — (1,601)
Net (loss) income (1,158) (365) 365 (1,158)
Other comprehensive income (loss) 23 35 (35) 23
Comprehensive (loss) income $ (1,135) $ (330) $ 330 $ (1,135)