Sprint - Nextel 2014 Annual Report Download - page 160
Download and view the complete annual report
Please find page 160 of the 2014 Sprint - Nextel annual report below. You can navigate through the pages in the report by either clicking on the pages listed below, or by using the keyword search tool below to find specific information within the annual report.-
 1
1 -
2
-
3
-
4
-
5
-
6
-
7
-
8
-
9
-
10
-
11
-
12
-
13
-
14
-
15
-
16
-
17
-
18
-
19
-
20
-
21
-
22
-
23
-
24
-
25
-
26
-
27
-
28
-
29
-
30
-
31
-
32
-
33
-
34
-
35
-
36
-
37
-
38
-
39
-
40
-
41
-
42
-
43
-
44
-
45
-
46
-
47
-
48
-
49
-
50
-
51
-
52
-
53
-
54
-
55
-
56
-
57
-
58
-
59
-
60
-
61
-
62
-
63
-
64
-
65
-
66
-
67
-
68
-
69
-
70
-
71
-
72
-
73
-
74
-
75
-
76
-
77
-
78
-
79
-
80
-
81
-
82
-
83
-
84
-
85
-
86
-
87
-
88
-
89
-
90
-
91
-
92
-
93
-
94
-
95
-
96
-
97
-
98
-
99
-
100
-
101
-
102
-
103
-
104
-
105
-
106
-
107
-
108
-
109
-
110
-
111
-
112
-
113
-
114
-
115
-
116
-
117
-
118
-
119
-
120
-
121
-
122
-
123
-
124
-
125
-
126
-
127
-
128
-
129
-
130
-
131
-
132
-
133
-
134
-
135
-
136
-
137
-
138
-
139
-
140
-
141
-
142
-
143
-
144
-
145
-
146
-
147
-
148
-
149
-
 150
150 -
 151
151 -
 152
152 -
 153
153 -
 154
154 -
 155
155 -
 156
156 -
 157
157 -
 158
158 -
 159
159 -
 160
160 -
 161
161 -
 162
162 -
 163
163 -
 164
164 -
 165
165 -
 166
166 -
 167
167 -
 168
168 -
 169
169 -
 170
170 -
171
-
172
-
173
-
174
-
175
-
176
-
177
-
178
-
179
-
180
-
181
-
182
-
183
-
184
-
185
-
186
-
187
-
188
-
189
-
190
-
191
-
192
-
193
-
194
 |
 |

Table of Contents
Index to Consolidated Financial Statements
CLEARWIRE CORPORATION AND SUBSIDIARIES
NOTES TO CONSOLIDATED FINANCIAL STATEMENTS —(CONTINUED)
F-77
approximates market value. Cash and cash equivalents exclude cash that is contractually restricted for operational
purposes. We maintain cash and cash equivalent balances with financial institutions that exceed federally insured
limits. We have not experienced any losses related to these balances, and management believes the credit risk related
to these balances to be minimal.
Restricted Cash — Restricted cash consists primarily of amounts to satisfy certain contractual obligations and
is classified as a current or non-current asset based on its designated purpose. The majority of this restricted cash has
been designated to satisfy certain lease obligations.
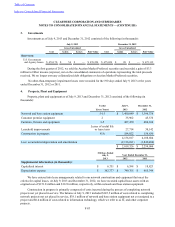
Investments — We have an investment portfolio comprised primarily of U.S. Government and Agency
marketable debt securities. We classify marketable debt securities as available-for-sale investments and these
securities are stated at their estimated fair value. Our investments are recorded as short-term investments when the
original maturities are greater than three months but remaining maturities are less than one year. Our investments
with maturities of more than one year are recorded as long-term investments. Unrealized gains and losses are
recorded within accumulated other comprehensive income (loss). Realized gains and losses are measured and
reclassified from accumulated other comprehensive income (loss) on the basis of the specific identification method.
We account for certain of our investments using the equity method based on our ownership interest and our
ability to exercise significant influence. Accordingly, we record our investment initially at cost and we adjust the
carrying amount of the investment to recognize our share of the earnings or losses of the investee each reporting
period. We cease to recognize investee losses when our investment basis is zero. At July 9, 2013 and December 31,
2012, our balance in equity method investees was $0.
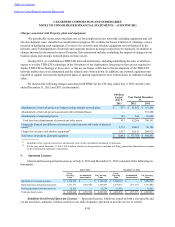
We recognize realized losses when declines in the fair value of our investments below their cost basis are
judged to be other-than-temporary. In determining whether a decline in fair value is other-than-temporary, we
consider various factors including market price, investment ratings, the financial condition and near-term prospects
of the issuer, the length of time and the extent to which the fair value has been less than the cost basis, and our intent
and ability to hold the investment until maturity or for a period of time sufficient to allow for any anticipated
recovery in market value. If it is judged that a decline in fair value is other-than-temporary, a realized loss equal to
the excess of the cost basis over fair value is recorded in the consolidated statements of operations, and a new cost
basis in the investment is established.
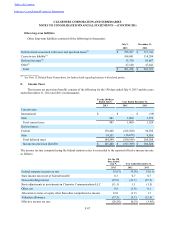
Fair Value Measurements — Fair value is the price that would be received to sell an asset or paid to transfer a
liability in an orderly transaction between market participants at the measurement date. In determining fair value, we
consider the principal or most advantageous market in which the asset or liability would transact, and if necessary,
consider assumptions that market participants would use when pricing the asset or liability.
The accounting guidance for fair value measurement requires an entity to maximize the use of observable
inputs and minimize the use of unobservable inputs when measuring fair value. The standard establishes a fair value
hierarchy based on the level of independent, objective evidence surrounding the inputs used to measure fair value.
Financial assets and financial liabilities are classified in the hierarchy based on the lowest level of input that is
significant to the fair value measurement. Our assessment of the significance of a particular input to the fair value
measurement requires judgment, and may affect the valuation of the assets and liabilities being measured and their
placement within the fair value hierarchy.