Sprint - Nextel 2014 Annual Report Download - page 90
Download and view the complete annual report
Please find page 90 of the 2014 Sprint - Nextel annual report below. You can navigate through the pages in the report by either clicking on the pages listed below, or by using the keyword search tool below to find specific information within the annual report.-
 1
1 -
2
-
3
-
4
-
5
-
6
-
7
-
8
-
9
-
10
-
11
-
12
-
13
-
14
-
15
-
16
-
17
-
18
-
19
-
20
-
21
-
22
-
23
-
24
-
25
-
26
-
27
-
28
-
29
-
30
-
31
-
32
-
33
-
34
-
35
-
36
-
37
-
38
-
39
-
40
-
41
-
42
-
43
-
44
-
45
-
46
-
47
-
48
-
49
-
50
-
51
-
52
-
53
-
54
-
55
-
56
-
57
-
58
-
59
-
60
-
61
-
62
-
63
-
64
-
65
-
66
-
67
-
68
-
69
-
70
-
71
-
72
-
73
-
74
-
75
-
76
-
77
-
78
-
79
-
 80
80 -
 81
81 -
 82
82 -
 83
83 -
 84
84 -
 85
85 -
 86
86 -
 87
87 -
 88
88 -
 89
89 -
 90
90 -
 91
91 -
 92
92 -
 93
93 -
 94
94 -
 95
95 -
 96
96 -
 97
97 -
 98
98 -
 99
99 -
 100
100 -
101
-
102
-
103
-
104
-
105
-
106
-
107
-
108
-
109
-
110
-
111
-
112
-
113
-
114
-
115
-
116
-
117
-
118
-
119
-
120
-
121
-
122
-
123
-
124
-
125
-
126
-
127
-
128
-
129
-
130
-
131
-
132
-
133
-
134
-
135
-
136
-
137
-
138
-
139
-
140
-
141
-
142
-
143
-
144
-
145
-
146
-
147
-
148
-
149
-
150
-
151
-
152
-
153
-
154
-
155
-
156
-
157
-
158
-
159
-
160
-
161
-
162
-
163
-
164
-
165
-
166
-
167
-
168
-
169
-
170
-
171
-
172
-
173
-
174
-
175
-
176
-
177
-
178
-
179
-
180
-
181
-
182
-
183
-
184
-
185
-
186
-
187
-
188
-
189
-
190
-
191
-
192
-
193
-
194
 |
 |

Table of Contents
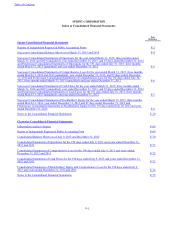
Index to Consolidated Financial Statements
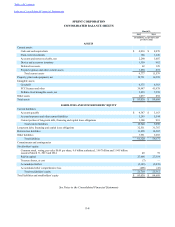
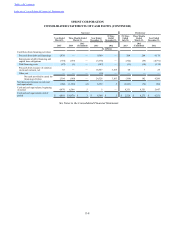
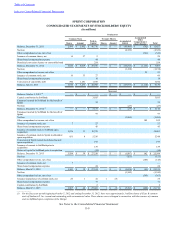
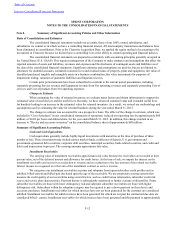
SPRINT CORPORATION
CONSOLIDATED STATEMENTS OF CASH FLOWS
F-7
Successor Predecessor
Year Ended
March 31, Three Months Ended
March 31, Year Ended
December 31,
87 Days
Ended
December 31,
191 Days
Ended
July 10,
Three Months
Ended
March 31, Year Ended
December 31,
2015 2014 2013
(Unaudited) 2013 2012 2013 2013
(Unaudited) 2012
(in millions)
Cash flows from operating activities:
Net loss $ (3,345) $ (151) $ (9) $ (1,860) $ (27) $ (1,158) $ (643) $ (4,326)
Adjustments to reconcile net loss to
net cash provided by (used in)
operating activities:
Asset impairments 2,133 75 — — — — — 102
Depreciation and amortization 5,349 1,297 — 2,934 — 3,245 1,492 6,543
Provision for losses on accounts
receivable 892 153 — 261 — 194 83 561
Share-based and long-term
incentive compensation expense 86 35 — 98 — 37 17 82
Deferred income tax (benefit)
expense (609) 46 (1) 32 1 1,586 24 209
Equity in losses of
unconsolidated investments, net — — — — — 482 202 1,114
Gain on previously-held equity
interests — — — — — (2,926) — —
Amortization and accretion of
long-term debt premiums and
discounts (303) (74) — (160) — 9 14 4
Other changes in assets and
liabilities:
Accounts and notes receivable (644) (232) (11) (558) (6) 150 215 (892)
Inventories and other current
assets (1,573) 173 — (391) — 298 243 (486)
Accounts payable and other
current liabilities 481 (490) 8 25 3 280 (734) 577
Non-current assets and
liabilities, net (199) (350) — (386) — 207 16 (119)
Other, net 182 40 11 (56) 29 267 11 (370)
Net cash provided by (used in)
operating activities 2,450 522 (2) (61) — 2,671 940 2,999
Cash flows from investing activities:
Capital expenditures - network and
other (5,422) (1,488) — (3,847) — (3,140) (1,381) (4,261)
Capital expenditures - leased
devices (582) — — — — — — —
Expenditures relating to FCC
licenses (163) (152) — (146) — (125) (55) (198)
Reimbursements relating to FCC
licenses 95 — — — — — — —
Acquisitions, net of cash acquired — — — (14,112) — (4,039) — —
Investment in Clearwire (including
debt securities) — — — — — (308) (80) (228)
Investment and derivative in Sprint
Communications, Inc. — — — — (3,100) — — —
Proceeds from sales and maturities
of short-term investments 3,131 920 — 1,715 — 2,445 1,281 1,513
Purchases of short-term investments (2,077) (1,035) — (1,719) — (1,221) (926) (3,212)
Proceeds from sales of assets and
FCC licenses 315 1 — 7 — 10 6 19
Other, net (11) (2) — (6) — (7) (3) (8)
Net cash used in investing
activities (4,714) (1,756) — (18,108) (3,100) (6,385) (1,158) (6,375)