Sprint - Nextel 2014 Annual Report Download - page 49
Download and view the complete annual report
Please find page 49 of the 2014 Sprint - Nextel annual report below. You can navigate through the pages in the report by either clicking on the pages listed below, or by using the keyword search tool below to find specific information within the annual report.-
 1
1 -
2
-
3
-
4
-
5
-
6
-
7
-
8
-
9
-
10
-
11
-
12
-
13
-
14
-
15
-
16
-
17
-
18
-
19
-
20
-
21
-
22
-
23
-
24
-
25
-
26
-
27
-
28
-
29
-
30
-
31
-
32
-
33
-
34
-
35
-
36
-
37
-
38
-
 39
39 -
 40
40 -
 41
41 -
 42
42 -
 43
43 -
 44
44 -
 45
45 -
 46
46 -
 47
47 -
 48
48 -
 49
49 -
 50
50 -
 51
51 -
 52
52 -
 53
53 -
 54
54 -
 55
55 -
 56
56 -
 57
57 -
 58
58 -
 59
59 -
60
-
61
-
62
-
63
-
64
-
65
-
66
-
67
-
68
-
69
-
70
-
71
-
72
-
73
-
74
-
75
-
76
-
77
-
78
-
79
-
80
-
81
-
82
-
83
-
84
-
85
-
86
-
87
-
88
-
89
-
90
-
91
-
92
-
93
-
94
-
95
-
96
-
97
-
98
-
99
-
100
-
101
-
102
-
103
-
104
-
105
-
106
-
107
-
108
-
109
-
110
-
111
-
112
-
113
-
114
-
115
-
116
-
117
-
118
-
119
-
120
-
121
-
122
-
123
-
124
-
125
-
126
-
127
-
128
-
129
-
130
-
131
-
132
-
133
-
134
-
135
-
136
-
137
-
138
-
139
-
140
-
141
-
142
-
143
-
144
-
145
-
146
-
147
-
148
-
149
-
150
-
151
-
152
-
153
-
154
-
155
-
156
-
157
-
158
-
159
-
160
-
161
-
162
-
163
-
164
-
165
-
166
-
167
-
168
-
169
-
170
-
171
-
172
-
173
-
174
-
175
-
176
-
177
-
178
-
179
-
180
-
181
-
182
-
183
-
184
-
185
-
186
-
187
-
188
-
189
-
190
-
191
-
192
-
193
-
194
 |
 |

Table of Contents
47
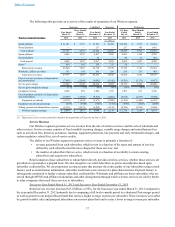
model related to our installment billing program for device purchases. The increase was partially offset by fewer postpaid and
prepaid handsets sold. Cost of products declined $255 million, or 11%, for the Successor three-month transition period ended
March 31, 2014 compared to the same Predecessor period in 2013, primarily due to fewer postpaid and prepaid handsets sold,
slightly offset by higher average cost per device sold for postpaid and prepaid devices.
Successor Year Ended December 31, 2013 and Predecessor Year Ended December 31, 2012
Equipment revenue decreased $1.5 billion, or 45%, and cost of products declined $5.3 billion, or 54%, for the
Successor year ended December 31, 2013 compared to the Predecessor year ended December 31, 2012, primarily due to
comparing operating results for the shortened Post-merger period to the 2012 Predecessor period consisting of a full calendar
year. In addition, the decrease in both equipment revenue and cost of products was due to fewer postpaid handsets sold,
which was partially offset by higher average sales prices per postpaid and prepaid device sold as well as increases in prepaid
handsets sold.
Combined Year Ended December 31, 2013 and Predecessor Year Ended December 31, 2012
Equipment revenues for the Combined year ended December 31, 2013 compared to the Predecessor year ended
December 31, 2012 increased primarily due to higher average sales prices per postpaid and prepaid device sold as well as
increases in prepaid volumes, partially offset by fewer postpaid handsets sold. Cost of products decreased primarily from
fewer postpaid handsets sold although at a higher average cost per handset, partially offset by an increase in average cost per
prepaid handset due to increased sales of more expensive 4G and LTE devices combined with fewer sales of low cost
Assurance wireless handsets.
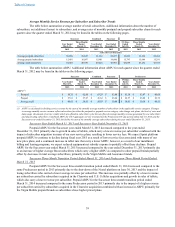
Selling, General and Administrative Expense
Sales and marketing costs primarily consist of subscriber acquisition costs, including commissions paid to our
indirect dealers, third-party distributors and retail sales force for new device activations and upgrades, residual payments to
our indirect dealers, payments made to OEMs for direct source equipment, payroll and facilities costs associated with our
retail sales force, marketing employees, advertising, media programs and sponsorships, including costs related to branding.
General and administrative expenses primarily consist of costs for billing, customer care and information technology
operations, bad debt expense and administrative support activities, including collections, legal, finance, human resources,
corporate communications, strategic planning, and technology and product development.
Successor Year Ended March 31, 2015 and Year Ended December 31, 2013
Sales and marketing expense was $5.3 billion for the year ended March 31, 2015 representing an increase of $2.7
billion, or 102%, compared to the year ended December 31, 2013. The increase was primarily due to comparing results for a
full twelve-month period ending March 31, 2015 to the shortened Post-merger period ending December 31, 2013, combined
with higher advertising costs related to new promotional campaigns. These increases were offset by a reduction in labor-
related costs due to our reduction in force and retail store closures in addition to lower commission expense as sales shifted to
more cost-effective channels, which resulted in an overall decrease in sales and marketing expense when comparing the
Successor year ended March 31, 2015 to the Combined year ended December 31, 2013.
General and administrative costs were $3.9 billion for the year ended March 31, 2015 representing an increase of
$2.0 billion, or 104%, compared to the year ended December 31, 2013, primarily due to comparing results for a full twelve-
month period ending March 31, 2015 to the shortened Post-merger period ending December 31, 2013, combined with an
increase in bad debt expense primarily associated with the increase in installment receivables. These increases were offset by
a decrease in customer care costs primarily due to lower call volumes and labor-related initiatives, which resulted in an
overall decrease in general and administrative costs when comparing the Successor year ended March 31, 2015 to the
Combined year ended December 31, 2013. We reassess our allowance for doubtful accounts quarterly. Changes in our
allowance for doubtful accounts are largely attributable to the analysis of historical collection experience and changes, if any,
in credit policies established for subscribers.
Successor Three-Month Transition Period Ended March 31, 2014 and Predecessor Three-Month Period Ended
March 31, 2013
Sales and marketing expense was $1.4 billion representing an increase of $70 million, or 5%, for the Successor
three-month transition period ended March 31, 2014 compared to the same Predecessor period in 2013. The increase was
primarily due to higher media spend and commission expense, partially offset by a reduction in labor related costs due to our
reduction in force and retail store closures.
General and administrative costs were $897 million, representing a decrease of $27 million, or 3%, for the
Successor three-month transition period ended March 31, 2014 compared to the same Predecessor period in 2013, primarily