Sprint - Nextel 2014 Annual Report Download - page 52
Download and view the complete annual report
Please find page 52 of the 2014 Sprint - Nextel annual report below. You can navigate through the pages in the report by either clicking on the pages listed below, or by using the keyword search tool below to find specific information within the annual report.-
 1
1 -
2
-
3
-
4
-
5
-
6
-
7
-
8
-
9
-
10
-
11
-
12
-
13
-
14
-
15
-
16
-
17
-
18
-
19
-
20
-
21
-
22
-
23
-
24
-
25
-
26
-
27
-
28
-
29
-
30
-
31
-
32
-
33
-
34
-
35
-
36
-
37
-
38
-
39
-
40
-
41
-
 42
42 -
 43
43 -
 44
44 -
 45
45 -
 46
46 -
 47
47 -
 48
48 -
 49
49 -
 50
50 -
 51
51 -
 52
52 -
 53
53 -
 54
54 -
 55
55 -
 56
56 -
 57
57 -
 58
58 -
 59
59 -
 60
60 -
 61
61 -
 62
62 -
63
-
64
-
65
-
66
-
67
-
68
-
69
-
70
-
71
-
72
-
73
-
74
-
75
-
76
-
77
-
78
-
79
-
80
-
81
-
82
-
83
-
84
-
85
-
86
-
87
-
88
-
89
-
90
-
91
-
92
-
93
-
94
-
95
-
96
-
97
-
98
-
99
-
100
-
101
-
102
-
103
-
104
-
105
-
106
-
107
-
108
-
109
-
110
-
111
-
112
-
113
-
114
-
115
-
116
-
117
-
118
-
119
-
120
-
121
-
122
-
123
-
124
-
125
-
126
-
127
-
128
-
129
-
130
-
131
-
132
-
133
-
134
-
135
-
136
-
137
-
138
-
139
-
140
-
141
-
142
-
143
-
144
-
145
-
146
-
147
-
148
-
149
-
150
-
151
-
152
-
153
-
154
-
155
-
156
-
157
-
158
-
159
-
160
-
161
-
162
-
163
-
164
-
165
-
166
-
167
-
168
-
169
-
170
-
171
-
172
-
173
-
174
-
175
-
176
-
177
-
178
-
179
-
180
-
181
-
182
-
183
-
184
-
185
-
186
-
187
-
188
-
189
-
190
-
191
-
192
-
193
-
194
 |
 |

Table of Contents
50
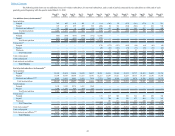
our Wireless segment and the elimination of backhaul associated with the decommissioning of the Nextel platform as of June
30, 2013. Sale of services to our Wireless segment represented 12% of total Internet revenues for the Successor year ended
March 31, 2015 compared to 11% in the year ended December 31, 2013.
Other Revenues
Other revenues, which primarily consist of sales of customer premises equipment, increased $42 million, or
131%, primarily due to comparing results for a full twelve-month period to a shortened Post-merger period.
Successor Three-Month Transition Period Ended March 31, 2014 and Predecessor Three-Month Period Ended
March 31, 2013
Voice Revenues
Voice revenues remained flat for the Successor three-month transition period ended March 31, 2014 compared to
the same Predecessor period in 2013. Overall rate declines were primarily due to the decline in prices for the sale of services
to our Wireless segment which were offset by increases in international hubbing volumes in the three-month transition period
ended March 31, 2014. Voice revenues generated from the sale of services to our Wireless segment represented 25% of total
voice revenues for the Successor three-month transition period ended March 31, 2014 compared to 28% for the Predecessor
three-month period ended March 31, 2013.
Data Revenues
Data revenues reflect sales of data services, primarily Private Line and managed network services bundled with
non-IP-based data access. Data revenues decreased $32 million, or 34%, for the Successor three-month transition period
ended March 31, 2014 compared to the same Predecessor period in 2013 as a result of customer churn, primarily related to
Private Line. Data revenues generated from the provision of services to the Wireless segment represented 42% of total data
revenue for the Successor three-month transition period ended March 31, 2014 compared to 49% for the Predecessor three-
month period ended March 31, 2013.
Internet Revenue
IP-based data services revenue reflects sales of Internet services, including MPLS, VoIP, SIP, and managed
services bundled with IP-based data access. IP-based data services decreased $89 million, or 21%, for the Successor three-
month transition period ended March 31, 2014 compared to the same Predecessor period in 2013, primarily due to fewer IP
customers, and in particular, the final transition to in-sourcing of one of our larger cable MSO's. Sale of services to our
Wireless segment represented 11% of total Internet revenues in both the Successor three-month transition period ended
March 31, 2014 and the Predecessor three-month period ended March 31, 2013.
Other Revenues
Other revenues, which primarily consist of sales of customer premises equipment, decreased $2 million, or 15%,
in the Successor three-month transition period ended March 31, 2014 compared to the same Predecessor period in 2013.
Successor Year Ended December 31, 2013 and Predecessor Year Ended December 31, 2012
Voice Revenues
Voice revenues decreased $908 million, or 56%, for the Successor year ended December 31, 2013 compared to the
Predecessor year ended December 31, 2012 primarily due to comparing operating results for the shortened Post-merger
period to a period consisting of a full calendar year. Voice revenues generated from the sale of services to our Wireless
segment represented 33% of total voice revenues for the year ended December 31, 2013 compared to 32% for the year ended
2012.
Data Revenues
Data revenues reflect sales of data services, primarily Private Line, and managed network services bundled with
non-IP-based data access. Data revenues decreased $260 million, or 65%, for the Successor year ended December 31, 2013
compared to the Predecessor year ended December 31, 2012 primarily due to comparing operating results for the shortened
Post-merger period to a period consisting of a full calendar year. Data revenues generated from the provision of services to
the Wireless segment represented 50% of total data revenue for the year ended December 31, 2013 compared to 44% for the
year ended 2012.
Internet Revenue
IP-based data services revenue reflects sales of Internet services, including MPLS, VoIP, SIP, and managed
services bundled with IP-based data access. IP-based data services decreased $1.0 billion, or 58%, for the Successor year