Sprint - Nextel 2014 Annual Report Download - page 179
Download and view the complete annual report
Please find page 179 of the 2014 Sprint - Nextel annual report below. You can navigate through the pages in the report by either clicking on the pages listed below, or by using the keyword search tool below to find specific information within the annual report.-
 1
1 -
2
-
3
-
4
-
5
-
6
-
7
-
8
-
9
-
10
-
11
-
12
-
13
-
14
-
15
-
16
-
17
-
18
-
19
-
20
-
21
-
22
-
23
-
24
-
25
-
26
-
27
-
28
-
29
-
30
-
31
-
32
-
33
-
34
-
35
-
36
-
37
-
38
-
39
-
40
-
41
-
42
-
43
-
44
-
45
-
46
-
47
-
48
-
49
-
50
-
51
-
52
-
53
-
54
-
55
-
56
-
57
-
58
-
59
-
60
-
61
-
62
-
63
-
64
-
65
-
66
-
67
-
68
-
69
-
70
-
71
-
72
-
73
-
74
-
75
-
76
-
77
-
78
-
79
-
80
-
81
-
82
-
83
-
84
-
85
-
86
-
87
-
88
-
89
-
90
-
91
-
92
-
93
-
94
-
95
-
96
-
97
-
98
-
99
-
100
-
101
-
102
-
103
-
104
-
105
-
106
-
107
-
108
-
109
-
110
-
111
-
112
-
113
-
114
-
115
-
116
-
117
-
118
-
119
-
120
-
121
-
122
-
123
-
124
-
125
-
126
-
127
-
128
-
129
-
130
-
131
-
132
-
133
-
134
-
135
-
136
-
137
-
138
-
139
-
140
-
141
-
142
-
143
-
144
-
145
-
146
-
147
-
148
-
149
-
150
-
151
-
152
-
153
-
154
-
155
-
156
-
157
-
158
-
159
-
160
-
161
-
162
-
163
-
164
-
165
-
166
-
167
-
168
-
 169
169 -
 170
170 -
 171
171 -
 172
172 -
 173
173 -
 174
174 -
 175
175 -
 176
176 -
 177
177 -
 178
178 -
 179
179 -
 180
180 -
 181
181 -
 182
182 -
 183
183 -
 184
184 -
 185
185 -
 186
186 -
 187
187 -
 188
188 -
 189
189 -
190
-
191
-
192
-
193
-
194
 |
 |

Table of Contents
Index to Consolidated Financial Statements
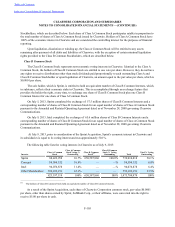
CLEARWIRE CORPORATION AND SUBSIDIARIES
NOTES TO CONSOLIDATED FINANCIAL STATEMENTS —(CONTINUED)
F-96
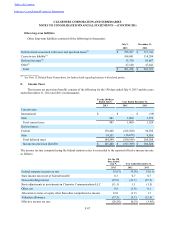
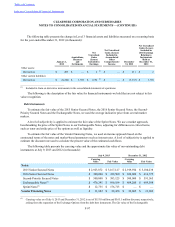
The following table summarizes our financial assets by level within the valuation hierarchy at July 9, 2013 (in
thousands):
Quoted
Prices in
Active
Markets
(Level 1)
Significant
Other
Observable
Inputs
(Level 2)
Significant
Unobservable
Inputs
(Level 3) Total
Fair Value
Financial assets:
Cash and cash equivalents $ 193,912 $ — $ — $ 193,912
Short-term investments $ 251,244 $ 224,980 $ — $ 476,224
Other assets — derivative warrant assets $ — $ — $ 215 $ 215
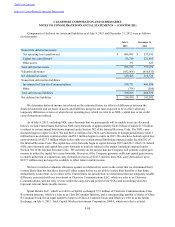
The following table summarizes our financial assets and liabilities by level within the valuation hierarchy at
December 31, 2012 (in thousands):
Quoted
Prices in
Active
Markets
(Level 1)
Significant
Other
Observable
Inputs
(Level 2)
Significant
Unobservable
Inputs
(Level 3) Total
Fair Value
Financial assets:
Cash and cash equivalents $ 193,445 $ — $ — $ 193,445
Short-term investments $ 375,743 $ 299,369 $ — $ 675,112
Other assets — derivative warrant assets $ — $ — $ 211 $ 211
Financial liabilities:
Other current liabilities — derivative liabilities (Exchange
Options) $ — $ — $ (5,333) $ (5,333)
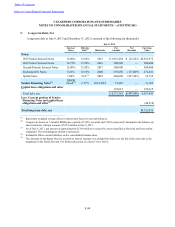
The following table presents the change in Level 3 financial assets and liabilities measured on a recurring basis for
the 190 days ended July 9, 2013 (in thousands):
January 1,
2013
Acquisitions,
Issuances
and
Settlements
Net Realized/
Unrealized
Gains
Included in
Earnings
Net Realized/
Unrealized
Gains (Losses)
Included in
Accumulated
Other
Comprehensive
Income July 9, 2013
Net Unrealized
Gains (Losses)
Included in
2012 Earnings
Relating to
Instruments
Held at July 9,
2013
Other assets:
Derivatives $ 211 $ — $ 4 (1) $ — $ 215 $ 4
Other current liabilities:
Derivatives $ (5,333) $ — $ 5,333 (1) $ — $ — $ 5,333
_____________________________________
(1) Included in Gain on derivative instruments in the consolidated statements of operations.