Sprint - Nextel 2014 Annual Report Download - page 39
Download and view the complete annual report
Please find page 39 of the 2014 Sprint - Nextel annual report below. You can navigate through the pages in the report by either clicking on the pages listed below, or by using the keyword search tool below to find specific information within the annual report.-
 1
1 -
2
-
3
-
4
-
5
-
6
-
7
-
8
-
9
-
10
-
11
-
12
-
13
-
14
-
15
-
16
-
17
-
18
-
19
-
20
-
21
-
22
-
23
-
24
-
25
-
26
-
27
-
28
-
 29
29 -
 30
30 -
 31
31 -
 32
32 -
 33
33 -
 34
34 -
 35
35 -
 36
36 -
 37
37 -
 38
38 -
 39
39 -
 40
40 -
 41
41 -
 42
42 -
 43
43 -
 44
44 -
 45
45 -
 46
46 -
 47
47 -
 48
48 -
 49
49 -
50
-
51
-
52
-
53
-
54
-
55
-
56
-
57
-
58
-
59
-
60
-
61
-
62
-
63
-
64
-
65
-
66
-
67
-
68
-
69
-
70
-
71
-
72
-
73
-
74
-
75
-
76
-
77
-
78
-
79
-
80
-
81
-
82
-
83
-
84
-
85
-
86
-
87
-
88
-
89
-
90
-
91
-
92
-
93
-
94
-
95
-
96
-
97
-
98
-
99
-
100
-
101
-
102
-
103
-
104
-
105
-
106
-
107
-
108
-
109
-
110
-
111
-
112
-
113
-
114
-
115
-
116
-
117
-
118
-
119
-
120
-
121
-
122
-
123
-
124
-
125
-
126
-
127
-
128
-
129
-
130
-
131
-
132
-
133
-
134
-
135
-
136
-
137
-
138
-
139
-
140
-
141
-
142
-
143
-
144
-
145
-
146
-
147
-
148
-
149
-
150
-
151
-
152
-
153
-
154
-
155
-
156
-
157
-
158
-
159
-
160
-
161
-
162
-
163
-
164
-
165
-
166
-
167
-
168
-
169
-
170
-
171
-
172
-
173
-
174
-
175
-
176
-
177
-
178
-
179
-
180
-
181
-
182
-
183
-
184
-
185
-
186
-
187
-
188
-
189
-
190
-
191
-
192
-
193
-
194
 |
 |
Table of Contents
37
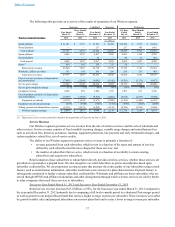
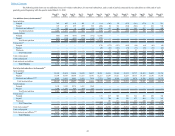
The following table provides an overview of the results of operations of our Wireless segment.
Successor Combined Successor Predecessor
Year Ended
March 31,
Three Months
Ended
March 31, Year Ended
December 31, Year Ended
December 31,
191 Days
Ended
July 10,
Three Months
Ended
March 31, Years Ended
December 31,
Wireless Segment Earnings 2015 2014 2013 2013 2013 2013 2012
(in millions)
Sprint platform $ 21,181 $ 5,719 $ 23,225 $ 10,983 $12,242 $ 5,773 $ 22,264
Nextel platform — — 217 — 217 143 1,455
Total postpaid 21,181 5,719 23,442 10,983 12,459 5,916 23,719
Sprint platform 4,905 1,232 4,867 2,265 2,602 1,194 4,380
Nextel platform — — 50 — 50 33 525
Total prepaid 4,905 1,232 4,917 2,265 2,652 1,227 4,905
Other(1) 458 145 359 331 28 — —
Retail service revenue 26,544 7,096 28,718 13,579 15,139 7,143 28,624
Wholesale, affiliate and other 793 159 545 266 279 133 483
Total service revenue 27,337 7,255 29,263 13,845 15,418 7,276 29,107
Cost of services (exclusive of depreciation
and amortization) (7,945) (2,106) (9,045) (4,342) (4,703) (2,171) (9,017)
Service gross margin 19,392 5,149 20,218 9,503 10,715 5,105 20,090
Service gross margin percentage 71 % 71 % 69 % 69 % 69 % 70 % 69 %
Equipment revenue 4,990 999 3,504 1,797 1,707 813 3,248
Cost of products (exclusive of depreciation
and amortization) (9,309) (2,038) (9,475) (4,603) (4,872) (2,293) (9,905)
Equipment net subsidy (4,319) (1,039) (5,971) (2,806) (3,165) (1,480) (6,657)
Equipment net subsidy percentage (87)% (104)% (170)% (156)% (185)% (182)% (205)%
Selling, general and administrative expense (9,179) (2,273) (9,299) (4,519) (4,780) (2,230) (9,286)
Wireless segment earnings $ 5,894 $ 1,837 $ 4,948 $ 2,178 $ 2,770 $ 1,395 $ 4,147
___________________
(1) Represents service revenue primarily related to the acquisition of Clearwire on July 9, 2013.
Service Revenue
Our Wireless segment generates service revenue from the sale of wireless services and the sale of wholesale and
other services. Service revenue consists of fixed monthly recurring charges, variable usage charges and miscellaneous fees
such as activation fees, directory assistance, roaming, equipment protection, late payment and early termination charges, and
certain regulatory related fees, net of service credits.
The ability of our Wireless segment to generate service revenue is primarily a function of:
• revenue generated from each subscriber, which in turn is a function of the types and amount of services
utilized by each subscriber and the rates charged for those services; and
• the number of subscribers that we serve, which in turn is a function of our ability to retain existing
subscribers and acquire new subscribers.
Retail comprises those subscribers to whom Sprint directly provides wireless services, whether those services are
provided on a postpaid or a prepaid basis. We also categorize our retail subscribers as prime and subprime based upon
subscriber credit profiles. We use proprietary scoring systems that measure the credit quality of our subscribers using several
factors, such as credit bureau information, subscriber credit risk scores and service plan characteristics. Payment history is
subsequently monitored to further evaluate subscriber credit profiles. Wholesale and affiliates are those subscribers who are
served through MVNO and affiliate relationships and other arrangements through which wireless services are sold by Sprint
to other companies that resell those services to subscribers.
Successor Year Ended March 31, 2015 and Successor Year Ended December 31, 2013
Retail service revenue increased $13.0 billion, or 95%, for the Successor year ended March 31, 2015 compared to
the year ended December 31, 2013 primarily due to comparing a full twelve-month period to a shortened Post-merger period
as well as growth in our prepaid Boost brand that carries a higher average revenue per subscriber. These increases were offset
by growth in tablet sales and postpaid subscribers on our new plans that tend to carry a lower average revenue per subscriber