Sprint - Nextel 2014 Annual Report Download - page 47
Download and view the complete annual report
Please find page 47 of the 2014 Sprint - Nextel annual report below. You can navigate through the pages in the report by either clicking on the pages listed below, or by using the keyword search tool below to find specific information within the annual report.-
 1
1 -
2
-
3
-
4
-
5
-
6
-
7
-
8
-
9
-
10
-
11
-
12
-
13
-
14
-
15
-
16
-
17
-
18
-
19
-
20
-
21
-
22
-
23
-
24
-
25
-
26
-
27
-
28
-
29
-
30
-
31
-
32
-
33
-
34
-
35
-
36
-
 37
37 -
 38
38 -
 39
39 -
 40
40 -
 41
41 -
 42
42 -
 43
43 -
 44
44 -
 45
45 -
 46
46 -
 47
47 -
 48
48 -
 49
49 -
 50
50 -
 51
51 -
 52
52 -
 53
53 -
 54
54 -
 55
55 -
 56
56 -
 57
57 -
58
-
59
-
60
-
61
-
62
-
63
-
64
-
65
-
66
-
67
-
68
-
69
-
70
-
71
-
72
-
73
-
74
-
75
-
76
-
77
-
78
-
79
-
80
-
81
-
82
-
83
-
84
-
85
-
86
-
87
-
88
-
89
-
90
-
91
-
92
-
93
-
94
-
95
-
96
-
97
-
98
-
99
-
100
-
101
-
102
-
103
-
104
-
105
-
106
-
107
-
108
-
109
-
110
-
111
-
112
-
113
-
114
-
115
-
116
-
117
-
118
-
119
-
120
-
121
-
122
-
123
-
124
-
125
-
126
-
127
-
128
-
129
-
130
-
131
-
132
-
133
-
134
-
135
-
136
-
137
-
138
-
139
-
140
-
141
-
142
-
143
-
144
-
145
-
146
-
147
-
148
-
149
-
150
-
151
-
152
-
153
-
154
-
155
-
156
-
157
-
158
-
159
-
160
-
161
-
162
-
163
-
164
-
165
-
166
-
167
-
168
-
169
-
170
-
171
-
172
-
173
-
174
-
175
-
176
-
177
-
178
-
179
-
180
-
181
-
182
-
183
-
184
-
185
-
186
-
187
-
188
-
189
-
190
-
191
-
192
-
193
-
194
 |
 |

Table of Contents
45
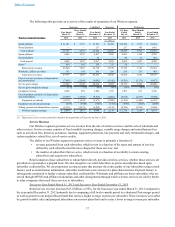
and connected devices that utilize our network. Of the 10.7 million Sprint Platform subscribers included in wholesale and
affiliates, approximately 54% represent connected devices. Wholesale and affiliate subscriber net additions were 2,349,000
during the Successor year ended March 31, 2015, as compared to 31,000 and 944,000 during the years ended December 31,
2013 (Combined) and December 31, 2012 (Predecessor), inclusive of net additions of connected devices totaling 1,950,000,
908,000 and 593,000, respectively. The increase in net additions in the Successor year ended March 31, 2015 as compared to
the Combined year ended December 31, 2013 is primarily attributable to growth in connected devices. Net additions were
212,000 during the Successor three-month transition period ended March 31, 2014 as compared to net losses of 224,000
during the Predecessor three-month period ended March 31, 2013, inclusive of net additions of connected devices totaling
304,000 and 133,000, respectively. Net additions were primarily attributable to growth in connected device subscribers as
compared to net losses in the Predecessor three-month period 2013 from the Lifeline programs offered by our MVNO's
selling prepaid services affected by new federal regulations, similar to the impact on our Assurance Wireless brand in Retail
Prepaid above. Our decline in net additions in the Combined year ended December 31, 2013 as compared the same period in
2012 (Predecessor) was primarily due to targeted efforts in calendar year 2013 and 2012 to reduce inactive subscriber
accounts by our wholesale MVNO customers as well as net losses attributable to new Lifeline program recertification
regulations as discussed in Retail Prepaid above, partially offset by increases in connected devices and growth in wholesale
postpaid resellers.
Transactions Subscribers
As part of the acquisition of assets from U.S. Cellular, which closed in May 2013, we acquired 352,000 postpaid
subscribers and 59,000 prepaid subscribers. As part of the Clearwire Acquisition in July 2013, we acquired 788,000 postpaid
subscribers (exclusive of Sprint platform wholesale subscribers acquired through our MVNO relationship with Clearwire that
were transferred to postpaid subscribers within Transactions), 721,000 prepaid subscribers, and 93,000 wholesale subscribers.
For the Successor year ended March 31, 2015, we had net postpaid subscriber losses of 218,000, net prepaid subscriber losses
of 189,000 and net wholesale subscriber additions of 75,000. For the Successor three-month transition period ended
March 31, 2014, we had net postpaid subscriber losses of 102,000, net prepaid subscriber losses of 51,000 and net wholesale
subscriber additions of 69,000, of which approximately 3,000 postpaid subscribers were recaptured on the Sprint platform.
For the remainder of the Combined year ended December 31, 2013, we had net postpaid subscriber losses of 481,000, net
prepaid subscriber losses of 179,000 and net wholesale subscriber additions of 38,000, of which approximately 106,000 and
8,000 postpaid and prepaid subscribers, respectively, were recaptured on the Sprint platform.
Cost of Services
Cost of services consists primarily of:
• costs to operate and maintain our networks, including direct switch and cell site costs, such as rent, utilities,
maintenance, labor costs associated with network employees, and spectrum frequency leasing costs;
• fixed and variable interconnection costs, the fixed component of which consists of monthly flat-rate fees for
facilities leased from local exchange carriers based on the number of cell sites and switches in service in a
particular period and the related equipment installed at each site, and the variable component of which
generally consists of per-minute use fees charged by wireline providers for calls terminating on their
networks, which fluctuate in relation to the level and duration of those terminating calls;
• long distance costs paid to the Wireline segment;
• costs to service and repair devices;
• regulatory fees;
• roaming fees paid to other carriers; and
• fixed and variable costs relating to payments to third parties for the use of their proprietary data applications,
such as messaging, music, TV, and navigation services by our subscribers.
Successor Year Ended March 31, 2015 and Successor Year Ended December 31, 2013
Cost of services increased $3.6 billion, or 83%, for the Successor year ended March 31, 2015 compared to the
year ended December 31, 2013. The increase was primarily due to comparing results for a full twelve-month period ending
March 31, 2015 to the shortened Post-merger period and increases as a result of the Clearwire Acquisition. These increases
were offset by decreases in roaming and other network costs such as rent, utilities, backhaul and labor as a result of declining
costs associated with improvements in the quality of our network and the shut-down of the Nextel platform in June 2013,
which resulted in an overall decrease in cost of services when comparing the Successor year ended March 31, 2015 to the
Combined year ended December 31, 2013.