Sprint - Nextel 2014 Annual Report Download - page 54
Download and view the complete annual report
Please find page 54 of the 2014 Sprint - Nextel annual report below. You can navigate through the pages in the report by either clicking on the pages listed below, or by using the keyword search tool below to find specific information within the annual report.-
 1
1 -
2
-
3
-
4
-
5
-
6
-
7
-
8
-
9
-
10
-
11
-
12
-
13
-
14
-
15
-
16
-
17
-
18
-
19
-
20
-
21
-
22
-
23
-
24
-
25
-
26
-
27
-
28
-
29
-
30
-
31
-
32
-
33
-
34
-
35
-
36
-
37
-
38
-
39
-
40
-
41
-
42
-
43
-
 44
44 -
 45
45 -
 46
46 -
 47
47 -
 48
48 -
 49
49 -
 50
50 -
 51
51 -
 52
52 -
 53
53 -
 54
54 -
 55
55 -
 56
56 -
 57
57 -
 58
58 -
 59
59 -
 60
60 -
 61
61 -
 62
62 -
 63
63 -
 64
64 -
65
-
66
-
67
-
68
-
69
-
70
-
71
-
72
-
73
-
74
-
75
-
76
-
77
-
78
-
79
-
80
-
81
-
82
-
83
-
84
-
85
-
86
-
87
-
88
-
89
-
90
-
91
-
92
-
93
-
94
-
95
-
96
-
97
-
98
-
99
-
100
-
101
-
102
-
103
-
104
-
105
-
106
-
107
-
108
-
109
-
110
-
111
-
112
-
113
-
114
-
115
-
116
-
117
-
118
-
119
-
120
-
121
-
122
-
123
-
124
-
125
-
126
-
127
-
128
-
129
-
130
-
131
-
132
-
133
-
134
-
135
-
136
-
137
-
138
-
139
-
140
-
141
-
142
-
143
-
144
-
145
-
146
-
147
-
148
-
149
-
150
-
151
-
152
-
153
-
154
-
155
-
156
-
157
-
158
-
159
-
160
-
161
-
162
-
163
-
164
-
165
-
166
-
167
-
168
-
169
-
170
-
171
-
172
-
173
-
174
-
175
-
176
-
177
-
178
-
179
-
180
-
181
-
182
-
183
-
184
-
185
-
186
-
187
-
188
-
189
-
190
-
191
-
192
-
193
-
194
 |
 |

Table of Contents
52
Selling, General and Administrative Expense
Successor Year Ended March 31, 2015 and Successor Year Ended December 31, 2013
Selling, general and administrative expense increased $184 million, or 103%, in the Successor year ended
March 31, 2015 compared to the year ended December 31, 2013 primarily due to comparing results for a full twelve-month
period to a shortened Post-merger period, partially offset by a decrease due to a reduction in shared administrative and
employee-related costs required to support the Wireline segment as a result of the decline in revenue, which resulted in an
overall decrease in selling, general and administrative expense when comparing the Successor year ended March 31, 2015 to
the Combined year ended December 31, 2013. Total selling, general and administrative expense as a percentage of net
services revenue was 13% in the Successor year ended March 31, 2015 compared to 11% in the year ended December 31,
2013.
Successor Three-Month Transition Period Ended March 31, 2014 and Predecessor Three-Month Period Ended
March 31, 2013
Selling, general and administrative expense decreased $14 million, or 13%, in the Successor three-month
transition period ended March 31, 2014 compared to the same Predecessor period in 2013. The decrease was primarily due to
a reduction in shared administrative and employee related costs required to support the Wireline segment as a result of the
decline in revenue. Total selling, general and administrative expense as a percentage of net services revenue was 12% in each
of the three-month periods ended March 31, 2014 (Successor) and 2013 (Predecessor).
Successor Year Ended December 31, 2013 and Predecessor Year Ended December 31, 2012
Selling, general and administrative expense decreased $272 million, or 60%, in the Successor year ended
December 31, 2013 compared to the Predecessor year ended December 31, 2012, primarily due to comparing operating
results for the shortened Post-merger period to a period consisting of a full calendar year. Total selling, general and
administrative expense as a percentage of net services revenue was 11% for the year ended December 31, 2013 and 12% for
the year ended 2012.
Combined Year Ended December 31, 2013 and Predecessor Year Ended December 31, 2012
In addition to the explanations above, selling, general and administrative expense for the Combined year ended
December 31, 2013 compared to the Predecessor year ended December 31, 2012 decreased primarily due to a reduction in
shared administrative and employee related costs required to support the Wireline segment as a result of the decline in
revenue.
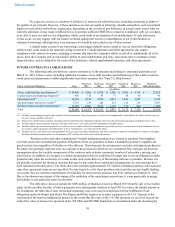
LIQUIDITY AND CAPITAL RESOURCES
Cash Flow
Successor Combined Successor Predecessor
Year Ended
March 31,
Three Months
Ended
March 31, Year Ended
December 31, Year Ended
December 31,
191 Days
Ended
July 10,
Three Months
Ended
March 31, Year Ended
December 31,
2015 2014 2013 2013 2013 2013 2012
(in millions)
Net cash provided by (used in) operating
activities $ 2,450 $ 522 $ 2,610 $ (61) $ 2,671 $ 940 $ 2,999
Net cash used in investing activities $ (4,714) $ (1,756) $ (24,493) $ (18,108) $ (6,385) $ (1,158) $ (6,375)
Net cash provided by (used in) financing
activities $ 1,304 $ (160) $ 24,419 $ 24,528 $ (109) $ 142 $ 4,280
Operating Activities
Net cash provided by operating activities of approximately $2.5 billion in the Successor year ended March 31, 2015
increased $2.5 billion from the Successor year ended December 31, 2013. The increase was primarily due to comparing a full
twelve-month period to a shortened Post-merger period. The Successor year ended December 31, 2013 included $180 million
of call redemption premiums paid to retire the Clearwire debt and approximately $225 million of interest payments related to
Clearwire debt. Net cash provided by operating activities of approximately $2.5 billion in the Successor year ended March 31,
2015 decreased $160 million as compared to net cash provided by operating activities of approximately $2.6 billion for the
year ended December 31, 2013, on a combined basis. The decrease was due to decreased cash received from customers of $1.1
billion primarily as a result of increases in installment billing receivables offset by declines due to the sales of receivables
through our receivables facility (see Receivables Facility below) as well as declines in net operating revenues and increased