Sprint - Nextel 2014 Annual Report Download - page 87
Download and view the complete annual report
Please find page 87 of the 2014 Sprint - Nextel annual report below. You can navigate through the pages in the report by either clicking on the pages listed below, or by using the keyword search tool below to find specific information within the annual report.-
 1
1 -
2
-
3
-
4
-
5
-
6
-
7
-
8
-
9
-
10
-
11
-
12
-
13
-
14
-
15
-
16
-
17
-
18
-
19
-
20
-
21
-
22
-
23
-
24
-
25
-
26
-
27
-
28
-
29
-
30
-
31
-
32
-
33
-
34
-
35
-
36
-
37
-
38
-
39
-
40
-
41
-
42
-
43
-
44
-
45
-
46
-
47
-
48
-
49
-
50
-
51
-
52
-
53
-
54
-
55
-
56
-
57
-
58
-
59
-
60
-
61
-
62
-
63
-
64
-
65
-
66
-
67
-
68
-
69
-
70
-
71
-
72
-
73
-
74
-
75
-
76
-
 77
77 -
 78
78 -
 79
79 -
 80
80 -
 81
81 -
 82
82 -
 83
83 -
 84
84 -
 85
85 -
 86
86 -
 87
87 -
 88
88 -
 89
89 -
 90
90 -
 91
91 -
 92
92 -
 93
93 -
 94
94 -
 95
95 -
 96
96 -
 97
97 -
98
-
99
-
100
-
101
-
102
-
103
-
104
-
105
-
106
-
107
-
108
-
109
-
110
-
111
-
112
-
113
-
114
-
115
-
116
-
117
-
118
-
119
-
120
-
121
-
122
-
123
-
124
-
125
-
126
-
127
-
128
-
129
-
130
-
131
-
132
-
133
-
134
-
135
-
136
-
137
-
138
-
139
-
140
-
141
-
142
-
143
-
144
-
145
-
146
-
147
-
148
-
149
-
150
-
151
-
152
-
153
-
154
-
155
-
156
-
157
-
158
-
159
-
160
-
161
-
162
-
163
-
164
-
165
-
166
-
167
-
168
-
169
-
170
-
171
-
172
-
173
-
174
-
175
-
176
-
177
-
178
-
179
-
180
-
181
-
182
-
183
-
184
-
185
-
186
-
187
-
188
-
189
-
190
-
191
-
192
-
193
-
194
 |
 |

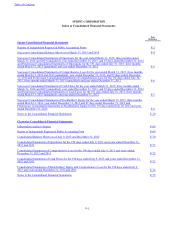
Table of Contents
Index to Consolidated Financial Statements
F-4
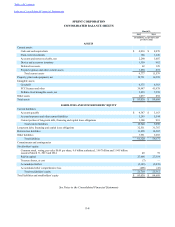
SPRINT CORPORATION
CONSOLIDATED BALANCE SHEETS
March 31,
2015 2014
(in millions, except share and
per share data)
ASSETS
Current assets:
Cash and cash equivalents $ 4,010 $ 4,970
Short-term investments 166 1,220
Accounts and notes receivable, net 2,290 3,607
Device and accessory inventory 1,359 982
Deferred tax assets 62 128
Prepaid expenses and other current assets 1,890 672
Total current assets 9,777 11,579
Property, plant and equipment, net 19,721 16,299
Intangible assets
Goodwill 6,575 6,383
FCC licenses and other 39,987 41,978
Definite-lived intangible assets, net 5,893 7,558
Other assets 1,077 892
Total assets $ 83,030 $ 84,689
LIABILITIES AND STOCKHOLDERS' EQUITY
Current liabilities:
Accounts payable $ 4,347 $ 3,163
Accrued expenses and other current liabilities 5,293 5,544
Current portion of long-term debt, financing and capital lease obligations 1,300 991
Total current liabilities 10,940 9,698
Long-term debt, financing and capital lease obligations 32,531 31,787
Deferred tax liabilities 13,898 14,207
Other liabilities 3,951 3,685
Total liabilities 61,320 59,377
Commitments and contingencies
Stockholders' equity:
Common stock, voting, par value $0.01 per share, 9.0 billion authorized, 3.967 billion and 3.941 billion
issued at March 31, 2015 and 2014 40 39
Paid-in capital 27,468 27,354
Treasury shares, at cost (7) —
Accumulated deficit (5,383) (2,038)
Accumulated other comprehensive loss (408) (43)
Total stockholders' equity 21,710 25,312
Total liabilities and stockholders' equity $ 83,030 $ 84,689
See Notes to the Consolidated Financial Statements