Sprint - Nextel 2014 Annual Report Download - page 139
Download and view the complete annual report
Please find page 139 of the 2014 Sprint - Nextel annual report below. You can navigate through the pages in the report by either clicking on the pages listed below, or by using the keyword search tool below to find specific information within the annual report.-
 1
1 -
2
-
3
-
4
-
5
-
6
-
7
-
8
-
9
-
10
-
11
-
12
-
13
-
14
-
15
-
16
-
17
-
18
-
19
-
20
-
21
-
22
-
23
-
24
-
25
-
26
-
27
-
28
-
29
-
30
-
31
-
32
-
33
-
34
-
35
-
36
-
37
-
38
-
39
-
40
-
41
-
42
-
43
-
44
-
45
-
46
-
47
-
48
-
49
-
50
-
51
-
52
-
53
-
54
-
55
-
56
-
57
-
58
-
59
-
60
-
61
-
62
-
63
-
64
-
65
-
66
-
67
-
68
-
69
-
70
-
71
-
72
-
73
-
74
-
75
-
76
-
77
-
78
-
79
-
80
-
81
-
82
-
83
-
84
-
85
-
86
-
87
-
88
-
89
-
90
-
91
-
92
-
93
-
94
-
95
-
96
-
97
-
98
-
99
-
100
-
101
-
102
-
103
-
104
-
105
-
106
-
107
-
108
-
109
-
110
-
111
-
112
-
113
-
114
-
115
-
116
-
117
-
118
-
119
-
120
-
121
-
122
-
123
-
124
-
125
-
126
-
127
-
128
-
 129
129 -
 130
130 -
 131
131 -
 132
132 -
 133
133 -
 134
134 -
 135
135 -
 136
136 -
 137
137 -
 138
138 -
 139
139 -
 140
140 -
 141
141 -
 142
142 -
 143
143 -
 144
144 -
 145
145 -
 146
146 -
 147
147 -
 148
148 -
 149
149 -
150
-
151
-
152
-
153
-
154
-
155
-
156
-
157
-
158
-
159
-
160
-
161
-
162
-
163
-
164
-
165
-
166
-
167
-
168
-
169
-
170
-
171
-
172
-
173
-
174
-
175
-
176
-
177
-
178
-
179
-
180
-
181
-
182
-
183
-
184
-
185
-
186
-
187
-
188
-
189
-
190
-
191
-
192
-
193
-
194
 |
 |

Table of Contents
Index to Consolidated Financial Statements
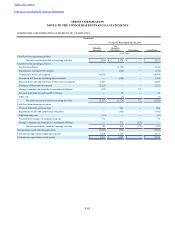
SPRINT CORPORATION
NOTES TO THE CONSOLIDATED FINANCIAL STATEMENTS
F-56
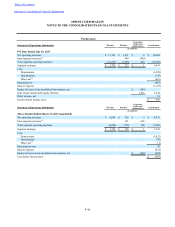
CONDENSED CONSOLIDATING STATEMENT OF COMPREHENSIVE LOSS
Successor
Year Ended March 31, 2015
Parent/
Issuer Subsidiary
Guarantor
Non-
Guarantor
Subsidiaries Eliminations Consolidated
(in millions)
Net operating revenues:
Service $ — $ — $ 29,542 $ — $ 29,542
Equipment — — 4,990 — 4,990
— — 34,532 — 34,532
Net operating expenses:
Cost of services (exclusive of depreciation and amortization below) — — 9,660 — 9,660
Cost of products (exclusive of depreciation and amortization below) — — 9,309 — 9,309
Selling, general and administrative — — 9,563 — 9,563
Impairments — — 2,133 — 2,133
Severance and exit costs — — 304 — 304
Depreciation — — 3,797 — 3,797
Amortization — — 1,552 — 1,552
Other, net — 1 108 — 109
— 1 36,426 — 36,427
Operating loss — (1) (1,894) — (1,895)
Other income (expense):
Interest income 687 146 3 (824) 12
Interest expense (687) (1,521) (667) 824 (2,051)
Equity in losses of unconsolidated investments, net — — — — —
Gain on previously-held equity interests — — — — —
(Losses) earnings of subsidiaries (3,345) (1,970) — 5,315 —
Other income, net — 1 14 — 15
(3,345) (3,344) (650) 5,315 (2,024)
(Loss) income before income taxes (3,345) (3,345) (2,544) 5,315 (3,919)
Income tax benefit — — 574 — 574
Net (loss) income (3,345) (3,345) (1,970) 5,315 (3,345)
Other comprehensive (loss) income (365) (365) (355) 720 (365)
Comprehensive (loss) income $ (3,710) $ (3,710) $ (2,325) $ 6,035 $ (3,710)