Sprint - Nextel 2014 Annual Report Download - page 154
Download and view the complete annual report
Please find page 154 of the 2014 Sprint - Nextel annual report below. You can navigate through the pages in the report by either clicking on the pages listed below, or by using the keyword search tool below to find specific information within the annual report.-
 1
1 -
2
-
3
-
4
-
5
-
6
-
7
-
8
-
9
-
10
-
11
-
12
-
13
-
14
-
15
-
16
-
17
-
18
-
19
-
20
-
21
-
22
-
23
-
24
-
25
-
26
-
27
-
28
-
29
-
30
-
31
-
32
-
33
-
34
-
35
-
36
-
37
-
38
-
39
-
40
-
41
-
42
-
43
-
44
-
45
-
46
-
47
-
48
-
49
-
50
-
51
-
52
-
53
-
54
-
55
-
56
-
57
-
58
-
59
-
60
-
61
-
62
-
63
-
64
-
65
-
66
-
67
-
68
-
69
-
70
-
71
-
72
-
73
-
74
-
75
-
76
-
77
-
78
-
79
-
80
-
81
-
82
-
83
-
84
-
85
-
86
-
87
-
88
-
89
-
90
-
91
-
92
-
93
-
94
-
95
-
96
-
97
-
98
-
99
-
100
-
101
-
102
-
103
-
104
-
105
-
106
-
107
-
108
-
109
-
110
-
111
-
112
-
113
-
114
-
115
-
116
-
117
-
118
-
119
-
120
-
121
-
122
-
123
-
124
-
125
-
126
-
127
-
128
-
129
-
130
-
131
-
132
-
133
-
134
-
135
-
136
-
137
-
138
-
139
-
140
-
141
-
142
-
143
-
 144
144 -
 145
145 -
 146
146 -
 147
147 -
 148
148 -
 149
149 -
 150
150 -
 151
151 -
 152
152 -
 153
153 -
 154
154 -
 155
155 -
 156
156 -
 157
157 -
 158
158 -
 159
159 -
 160
160 -
 161
161 -
 162
162 -
 163
163 -
 164
164 -
165
-
166
-
167
-
168
-
169
-
170
-
171
-
172
-
173
-
174
-
175
-
176
-
177
-
178
-
179
-
180
-
181
-
182
-
183
-
184
-
185
-
186
-
187
-
188
-
189
-
190
-
191
-
192
-
193
-
194
 |
 |

Table of Contents
Index to Consolidated Financial Statements
F-71
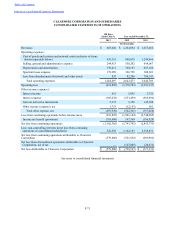
CLEARWIRE CORPORATION AND SUBSIDIARIES
CONSOLIDATED STATEMENTS OF OPERATIONS
190 Days
Ended July 9, Year ended December 31,
2013 2012 2011
(In thousands)
Revenues $ 665,602 $ 1,264,694 $ 1,253,466
Operating expenses:
Cost of goods and services and network costs (exclusive of items
shown separately below) 439,351 908,078 1,249,966
Selling, general and administrative expense 294,913 558,202 698,067
Depreciation and amortization 370,411 768,193 687,636
Spectrum lease expense 178,989 326,798 308,693
Loss from abandonment of network and other assets 833 82,206 700,341
Total operating expenses 1,284,497 2,643,477 3,644,703
Operating loss (618,895)(1,378,783)(2,391,237)
Other income (expense):
Interest income 612 1,895 2,335
Interest expense (305,632)(553,459)(505,992)
Gain on derivative instruments 5,337 1,356 145,308
Other income (expense), net 1,753 (12,153) 681
Total other expense, net (297,930)(562,361)(357,668)
Loss from continuing operations before income taxes (916,825)(1,941,144)(2,748,905)
Income tax benefit (provision) (185,480) 197,399 (106,828)
Net loss from continuing operations (1,102,305)(1,743,745)(2,855,733)
Less: non-controlling interests in net loss from continuing
operations of consolidated subsidiaries 522,505 1,182,183 2,158,831
Net loss from continuing operations attributable to Clearwire
Corporation (579,800)(561,562)(696,902)
Net loss from discontinued operations attributable to Clearwire
Corporation, net of tax —(167,005)(20,431)
Net loss attributable to Clearwire Corporation $ (579,800) $ (728,567) $ (717,333)
See notes to consolidated financial statements