Sprint - Nextel 2014 Annual Report Download - page 88
Download and view the complete annual report
Please find page 88 of the 2014 Sprint - Nextel annual report below. You can navigate through the pages in the report by either clicking on the pages listed below, or by using the keyword search tool below to find specific information within the annual report.-
 1
1 -
2
-
3
-
4
-
5
-
6
-
7
-
8
-
9
-
10
-
11
-
12
-
13
-
14
-
15
-
16
-
17
-
18
-
19
-
20
-
21
-
22
-
23
-
24
-
25
-
26
-
27
-
28
-
29
-
30
-
31
-
32
-
33
-
34
-
35
-
36
-
37
-
38
-
39
-
40
-
41
-
42
-
43
-
44
-
45
-
46
-
47
-
48
-
49
-
50
-
51
-
52
-
53
-
54
-
55
-
56
-
57
-
58
-
59
-
60
-
61
-
62
-
63
-
64
-
65
-
66
-
67
-
68
-
69
-
70
-
71
-
72
-
73
-
74
-
75
-
76
-
77
-
 78
78 -
 79
79 -
 80
80 -
 81
81 -
 82
82 -
 83
83 -
 84
84 -
 85
85 -
 86
86 -
 87
87 -
 88
88 -
 89
89 -
 90
90 -
 91
91 -
 92
92 -
 93
93 -
 94
94 -
 95
95 -
 96
96 -
 97
97 -
 98
98 -
99
-
100
-
101
-
102
-
103
-
104
-
105
-
106
-
107
-
108
-
109
-
110
-
111
-
112
-
113
-
114
-
115
-
116
-
117
-
118
-
119
-
120
-
121
-
122
-
123
-
124
-
125
-
126
-
127
-
128
-
129
-
130
-
131
-
132
-
133
-
134
-
135
-
136
-
137
-
138
-
139
-
140
-
141
-
142
-
143
-
144
-
145
-
146
-
147
-
148
-
149
-
150
-
151
-
152
-
153
-
154
-
155
-
156
-
157
-
158
-
159
-
160
-
161
-
162
-
163
-
164
-
165
-
166
-
167
-
168
-
169
-
170
-
171
-
172
-
173
-
174
-
175
-
176
-
177
-
178
-
179
-
180
-
181
-
182
-
183
-
184
-
185
-
186
-
187
-
188
-
189
-
190
-
191
-
192
-
193
-
194
 |
 |

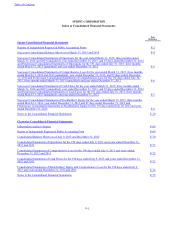
Table of Contents
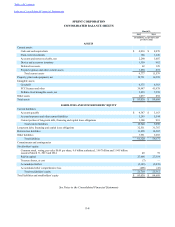
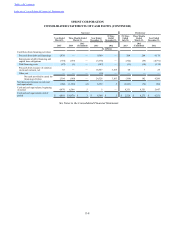
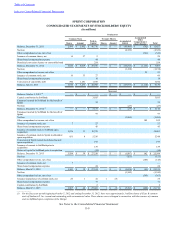
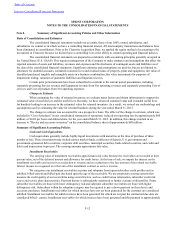
Index to Consolidated Financial Statements
F-5
SPRINT CORPORATION
CONSOLIDATED STATEMENTS OF OPERATIONS
Successor Predecessor
Year Ended
March 31, Three Months Ended
March 31, Year Ended
December 31,
87 Days
Ended
December 31,
191 Days
Ended
July 10,
Three Months
Ended
March 31, Year Ended
December 31,
2015 2014 2013
(Unaudited) 2013 2012 2013 2013
(Unaudited) 2012
(in millions, except per share amounts)
Net operating revenues:
Service $ 29,542 $ 7,876 $ — $ 15,094 $ — $ 16,895 $ 7,980 $ 32,097
Equipment 4,990 999 — 1,797 — 1,707 813 3,248
34,532 8,875 — 16,891 — 18,602 8,793 35,345
Net operating expenses:
Cost of services (exclusive of
depreciation and amortization
below) 9,660 2,622 — 5,174 — 5,673 2,640 10,936
Cost of products (exclusive of
depreciation and amortization
below) 9,309 2,038 — 4,603 — 4,872 2,293 9,905
Selling, general and administrative 9,563 2,371 14 4,841 33 5,067 2,336 9,765
Impairments 2,133 75 — — — — — 102
Severance and exit costs 304 52 — 309 — 652 25 196
Depreciation 3,797 868 — 2,026 — 3,098 1,422 6,240
Amortization 1,552 429 — 908 — 147 70 303
Other, net 109 — — — — (22) (22) (282)
36,427 8,455 14 17,861 33 19,487 8,764 37,165
Operating (loss) income (1,895) 420 (14) (970) (33) (885) 29 (1,820)
Other (expense) income:
Interest expense (2,051) (516) — (918) — (1,135) (432) (1,428)
Equity in losses of unconsolidated
investments, net — — — — — (482) (202) (1,114)
Gain on previously-held equity
interests — — — — — 2,926 — —
Other income (expense), net 27 1 6 73 10 19 — 190
(2,024) (515) 6 (845) 10 1,328 (634) (2,352)
(Loss) income before income taxes (3,919) (95) (8) (1,815) (23) 443 (605) (4,172)
Income tax benefit (expense) 574 (56) (1) (45) (4) (1,601) (38) (154)
Net loss $ (3,345) $ (151) $ (9) $ (1,860) $ (27) $ (1,158) $ (643) $ (4,326)
Basic and diluted net loss per common
share $ (0.85) $ (0.04) $ (0.54) $ (0.38) $ (0.21) $ (1.44)
Basic and diluted weighted average
common shares outstanding 3,953 3,949 3,475 3,027 3,013 3,002
See Notes to the Consolidated Financial Statements