Starbucks 2015 Annual Report Download - page 10
Download and view the complete annual report
Please find page 10 of the 2015 Starbucks annual report below. You can navigate through the pages in the report by either clicking on the pages listed below, or by using the keyword search tool below to find specific information within the annual report.-
 1
1 -
 2
2 -
 3
3 -
 4
4 -
 5
5 -
 6
6 -
 7
7 -
 8
8 -
 9
9 -
 10
10 -
 11
11 -
 12
12 -
 13
13 -
 14
14 -
 15
15 -
 16
16 -
 17
17 -
 18
18 -
 19
19 -
 20
20 -
 21
21 -
22
-
23
-
24
-
25
-
26
-
27
-
28
-
29
-
30
-
31
-
32
-
33
-
34
-
35
-
36
-
37
-
38
-
39
-
40
-
41
-
42
-
43
-
44
-
45
-
46
-
47
-
48
-
49
-
50
-
51
-
52
-
53
-
54
-
55
-
56
-
57
-
58
-
59
-
60
-
61
-
62
-
63
-
64
-
65
-
66
-
67
-
68
-
69
-
70
-
71
-
72
-
73
-
74
-
75
-
76
-
77
-
78
-
79
-
80
-
81
-
82
-
83
-
84
-
85
-
86
-
87
-
88
-
89
-
90
-
91
-
92
-
93
-
94
-
95
-
96
-
97
-
98
-
99
-
100
-
101
-
102
-
103
-
104
-
105
-
106
-
107
-
108
 |
 |
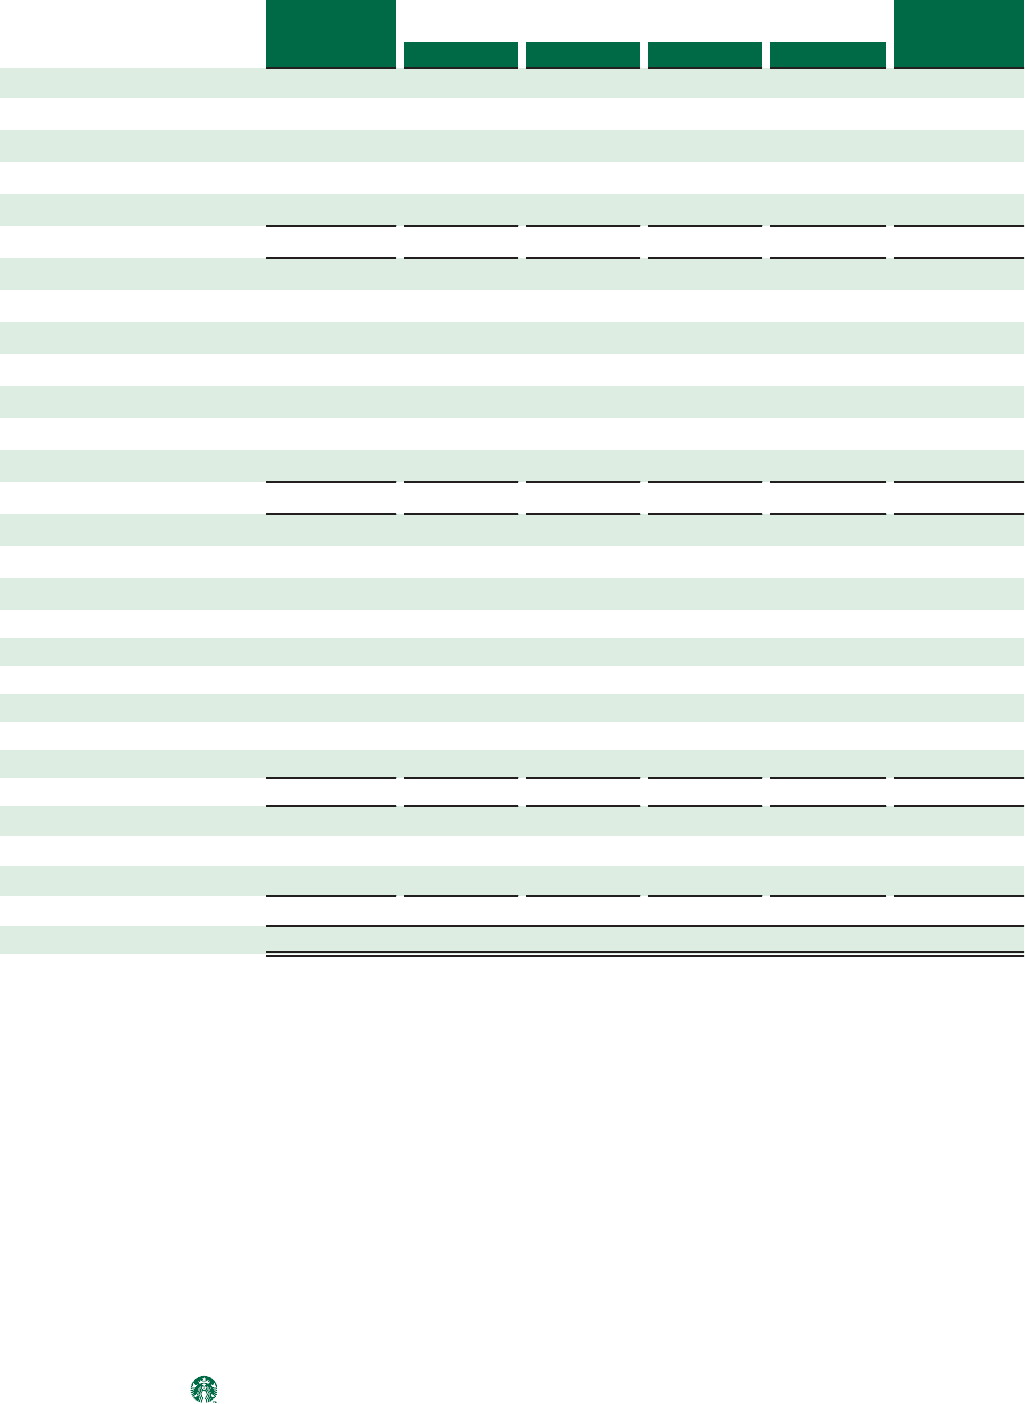
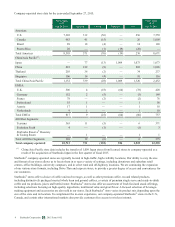
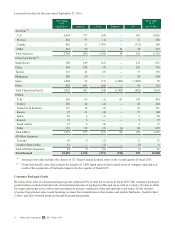
Licensed store data for the year-ended September 27, 2015:
Stores Open
as of
Stores Open
as of
Sep 28, 2014 Opened Closed Transfers Net Sep 27, 2015
Americas(1):
U.S. 4,659 357 (54) — 303 4,962
Mexico 434 73 (1) — 72 506
Canada 462 23 (136) — (113) 349
Other 241 55 — 19 74 315
Total Americas 5,796 508 (191) 19 336 6,132
China/Asia Pacific(2):
South Korea 700 149 (18) — 131 831
China 544 244 (3) — 241 785
Taiwan 323 41 (8) — 33 356
Philippines 240 24 — — 24 264
Japan 1,060 22 (15)(1,009)(1,002) 58
Other 625 101 (10) — 91 716
Total China/Asia Pacific 3,492 581 (54)(1,009)(482) 3,010
EMEA:
U.K. 285 65 (1) 65 129 414
Turkey 220 44 (4) — 40 260
United Arab Emirates 115 18 (2) — 16 131
Russia 87 21 (4) — 17 104
Spain 86 4 (1) — 3 89
Kuwait 72 5 — — 5 77
Saudi Arabia 67 8 (4) — 4 71
Other 391 92 (3)(1) 88 479
Total EMEA 1,323 257 (19) 64 302 1,625
All Other Segments:
Teavana 29 8 (2) — 6 35
Seattle's Best Coffee 13 — (7) — (7) 6
Total All Other Segments 42 8 (9) — (1) 41
Total licensed 10,653 1,354 (273)(926) 155 10,808
(1) Americas store data includes the closure of 132 Target Canada licensed stores in the second quarter of fiscal 2015.
(2) China/Asia Pacific store data includes the transfer of 1,009 Japan stores from licensed stores to company-operated as a
result of the acquisition of Starbucks Japan in the first quarter of fiscal 2015.
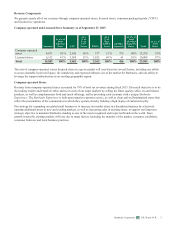
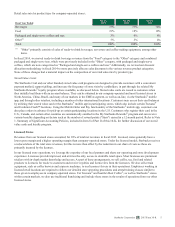
Consumer Packaged Goods
Revenues from sales of consumer packaged goods comprised 8% of total net revenues in fiscal 2015. Our consumer packaged
goods business includes both domestic and international sales of packaged coffee and tea as well as a variety of ready-to-drink
beverages and single-serve coffee and tea products to grocery, warehouse clubs and specialty retail stores. It also includes
revenues from product sales to and licensing revenues from manufacturers that produce and market Starbucks-, Seattle’s Best
Coffee- and Tazo-branded products through licensing agreements.
6 Starbucks Corporation 2015 Form 10-K