Starbucks 2015 Annual Report Download - page 7
Download and view the complete annual report
Please find page 7 of the 2015 Starbucks annual report below. You can navigate through the pages in the report by either clicking on the pages listed below, or by using the keyword search tool below to find specific information within the annual report.-
 1
1 -
 2
2 -
 3
3 -
 4
4 -
 5
5 -
 6
6 -
 7
7 -
 8
8 -
 9
9 -
 10
10 -
 11
11 -
 12
12 -
 13
13 -
 14
14 -
 15
15 -
 16
16 -
 17
17 -
 18
18 -
19
-
20
-
21
-
22
-
23
-
24
-
25
-
26
-
27
-
28
-
29
-
30
-
31
-
32
-
33
-
34
-
35
-
36
-
37
-
38
-
39
-
40
-
41
-
42
-
43
-
44
-
45
-
46
-
47
-
48
-
49
-
50
-
51
-
52
-
53
-
54
-
55
-
56
-
57
-
58
-
59
-
60
-
61
-
62
-
63
-
64
-
65
-
66
-
67
-
68
-
69
-
70
-
71
-
72
-
73
-
74
-
75
-
76
-
77
-
78
-
79
-
80
-
81
-
82
-
83
-
84
-
85
-
86
-
87
-
88
-
89
-
90
-
91
-
92
-
93
-
94
-
95
-
96
-
97
-
98
-
99
-
100
-
101
-
102
-
103
-
104
-
105
-
106
-
107
-
108
 |
 |
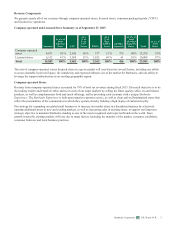
Revenue Components
We generate nearly all of our revenues through company-operated stores, licensed stores, consumer packaged goods ("CPG")
and foodservice operations.
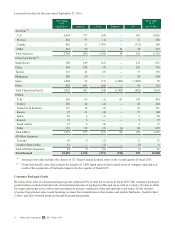
Company-operated and Licensed Store Summary as of September 27, 2015
Americas
As a% of
Total
Americas
Stores CAP
As a
% of
Total
CAP
Stores EMEA
As a
% of
Total
EMEA
Stores
All Other
Segments
As a% of
Total
All Other
Segments
Stores Total
As a% of
Total
Stores
Company-operated
stores 8,671 59 % 2,452 45 % 737 31 % 375 90 % 12,235 53 %
Licensed stores 6,132 41 % 3,010 55 % 1,625 69 % 41 10 % 10,808 47 %
Total 14,803 100% 5,462 100% 2,362 100% 416 100% 23,043 100%
The mix of company-operated versus licensed stores in a given market will vary based on several factors, including our ability
to access desirable local retail space, the complexity and expected ultimate size of the market for Starbucks, and our ability to
leverage the support infrastructure in an existing geographic region.
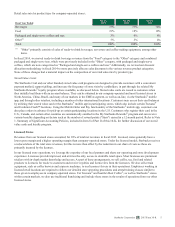
Company-operated Stores
Revenue from company-operated stores accounted for 79% of total net revenues during fiscal 2015. Our retail objective is to be
the leading retailer and brand of coffee and tea in each of our target markets by selling the finest quality coffee, tea and related
products, as well as complementary food and snack offerings, and by providing each customer with a unique Starbucks
Experience. The Starbucks Experience is built upon superior customer service, as well as clean and well-maintained stores that
reflect the personalities of the communities in which they operate, thereby building a high degree of customer loyalty.
Our strategy for expanding our global retail business is to increase our market share in a disciplined manner, by selectively
opening additional stores in new and existing markets, as well as increasing sales in existing stores, to support our long-term
strategic objective to maintain Starbucks standing as one of the most recognized and respected brands in the world. Store
growth in specific existing markets will vary due to many factors, including the maturity of the market, economic conditions,
consumer behavior and local business practices.
Starbucks Corporation 2015 Form 10-K 3