Starbucks 2015 Annual Report Download - page 40
Download and view the complete annual report
Please find page 40 of the 2015 Starbucks annual report below. You can navigate through the pages in the report by either clicking on the pages listed below, or by using the keyword search tool below to find specific information within the annual report.-
 1
1 -
2
-
3
-
4
-
5
-
6
-
7
-
8
-
9
-
10
-
11
-
12
-
13
-
14
-
15
-
16
-
17
-
18
-
19
-
20
-
21
-
22
-
23
-
24
-
25
-
26
-
27
-
28
-
29
-
 30
30 -
 31
31 -
 32
32 -
 33
33 -
 34
34 -
 35
35 -
 36
36 -
 37
37 -
 38
38 -
 39
39 -
 40
40 -
 41
41 -
 42
42 -
 43
43 -
 44
44 -
 45
45 -
 46
46 -
 47
47 -
 48
48 -
 49
49 -
 50
50 -
51
-
52
-
53
-
54
-
55
-
56
-
57
-
58
-
59
-
60
-
61
-
62
-
63
-
64
-
65
-
66
-
67
-
68
-
69
-
70
-
71
-
72
-
73
-
74
-
75
-
76
-
77
-
78
-
79
-
80
-
81
-
82
-
83
-
84
-
85
-
86
-
87
-
88
-
89
-
90
-
91
-
92
-
93
-
94
-
95
-
96
-
97
-
98
-
99
-
100
-
101
-
102
-
103
-
104
-
105
-
106
-
107
-
108
 |
 |
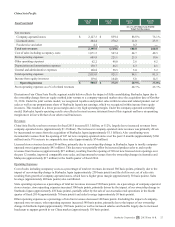
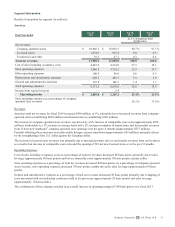
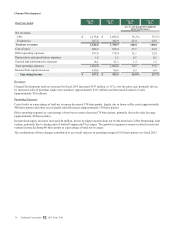
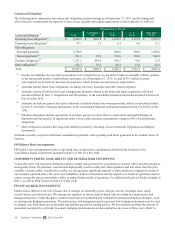
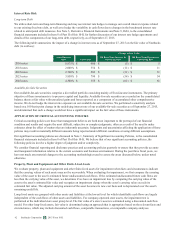
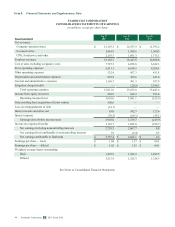
Channel Development
Fiscal Year Ended
Sep 28,
2014
Sep 29,
2013
Sep 28,
2014
Sep 29,
2013
As a % of Channel Development
Total Net Revenues
Net revenues:
CPG $ 1,178.8 $ 1,056.0 76.2 % 75.5 %
Foodservice 367.2 342.9 23.8 24.5
Total net revenues 1,546.0 1,398.9 100.0 100.0
Cost of sales 882.4 878.4 57.1 62.8
Other operating expenses 187.0 179.4 12.1 12.8
Depreciation and amortization expenses 1.8 1.1 0.1 0.1
General and administrative expenses 18.2 21.1 1.2 1.5
Total operating expenses 1,089.4 1,080.0 70.5 77.2
Income from equity investees 100.6 96.6 6.5 6.9
Operating income $ 557.2 $ 415.5 36.0% 29.7%
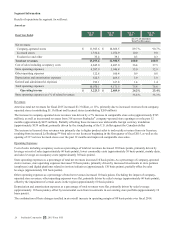
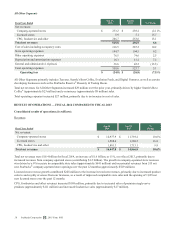
Revenues
Channel Development total net revenues for fiscal 2014 increased $147 million, or 11%, over the prior year, primarily driven
by increased sales of premium single-serve products (approximately $111 million) and increased foodservice sales
(approximately $24 million).
Operating Expenses
Cost of sales as a percentage of total net revenues decreased 570 basis points, largely due to lower coffee costs (approximately
440 basis points) and other cost of goods sold efficiencies (approximately 150 basis points).
Other operating expenses as a percentage of total net revenues decreased 70 basis points, primarily driven by sales leverage
(approximately 40 basis points).
Income from equity investees increased $4 million, driven by higher income from our North American Coffee Partnership joint
venture, primarily due to strong sales of bottled Frappuccino® beverages. The growth in segment revenues resulted in our joint
venture income declining 40 basis points as a percentage of total net revenues.
The combination of these changes contributed to an overall increase in operating margin of 630 basis points over fiscal 2013.
36 Starbucks Corporation 2015 Form 10-K