Starbucks 2015 Annual Report Download - page 33
Download and view the complete annual report
Please find page 33 of the 2015 Starbucks annual report below. You can navigate through the pages in the report by either clicking on the pages listed below, or by using the keyword search tool below to find specific information within the annual report.-
 1
1 -
2
-
3
-
4
-
5
-
6
-
7
-
8
-
9
-
10
-
11
-
12
-
13
-
14
-
15
-
16
-
17
-
18
-
19
-
20
-
21
-
22
-
 23
23 -
 24
24 -
 25
25 -
 26
26 -
 27
27 -
 28
28 -
 29
29 -
 30
30 -
 31
31 -
 32
32 -
 33
33 -
 34
34 -
 35
35 -
 36
36 -
 37
37 -
 38
38 -
 39
39 -
 40
40 -
 41
41 -
 42
42 -
 43
43 -
44
-
45
-
46
-
47
-
48
-
49
-
50
-
51
-
52
-
53
-
54
-
55
-
56
-
57
-
58
-
59
-
60
-
61
-
62
-
63
-
64
-
65
-
66
-
67
-
68
-
69
-
70
-
71
-
72
-
73
-
74
-
75
-
76
-
77
-
78
-
79
-
80
-
81
-
82
-
83
-
84
-
85
-
86
-
87
-
88
-
89
-
90
-
91
-
92
-
93
-
94
-
95
-
96
-
97
-
98
-
99
-
100
-
101
-
102
-
103
-
104
-
105
-
106
-
107
-
108
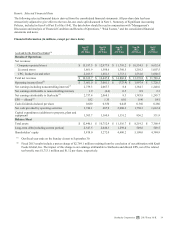
 |
 |

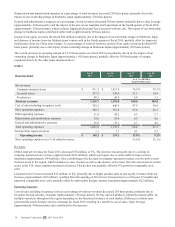
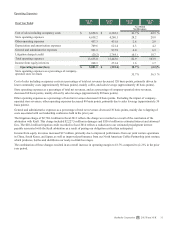
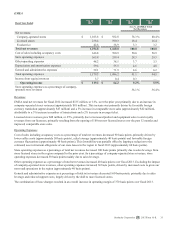
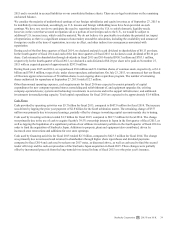
Store operating expenses as a percentage of total net revenues decreased 290 basis points. As a percentage of company-
operated store revenues, store operating expenses decreased 220 basis points primarily due to gains on the sales of certain store
assets in the region (approximately 150 basis points) as well as decreased expenses, largely salaries and benefits, driven by the
shift to more licensed stores (approximately 40 basis points).
Other operating expenses as a percentage of total net revenues increased 60 basis points. Excluding the impact of company-
operated store revenues, other operating expenses decreased 20 basis points, primarily driven by the gain on the sale of certain
assets in the region (approximately 40 basis points) and improved collection results (approximately 20 basis points). These
decreases were partially offset by increased costs to grow our non-retail operations in the region (approximately 50 basis
points), largely driven by higher marketing costs.
The combination of these changes resulted in an overall increase in operating margin of 460 basis points over fiscal 2014.
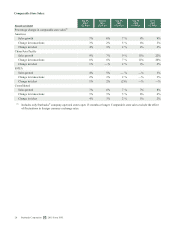
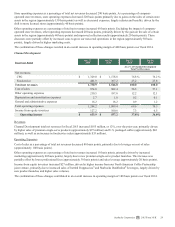
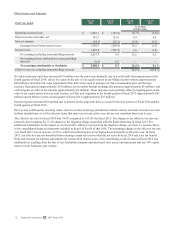
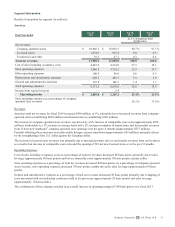
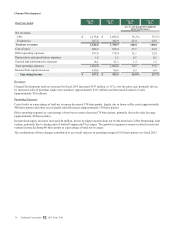
Channel Development
Fiscal Year Ended
Sep 27,
2015
Sep 28,
2014
Sep 27,
2015
Sep 28,
2014
As a % of Channel Development
Total Net Revenues
Net revenues:
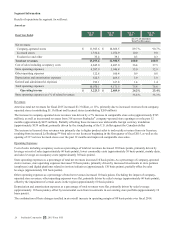
CPG $ 1,329.0 $ 1,178.8 76.8 % 76.2 %
Foodservice 401.9 367.2 23.2 23.8
Total net revenues 1,730.9 1,546.0 100.0 100.0
Cost of sales 974.8 882.4 56.3 57.1
Other operating expenses 210.5 187.0 12.2 12.1
Depreciation and amortization expenses 2.7 1.8 0.2 0.1
General and administrative expenses 16.2 18.2 0.9 1.2
Total operating expenses 1,204.2 1,089.4 69.6 70.5
Income from equity investees 127.2 100.6 7.3 6.5
Operating income $ 653.9 $ 557.2 37.8% 36.0%
Revenues
Channel Development total net revenues for fiscal 2015 increased $185 million, or 12%, over the prior year, primarily driven
by higher sales of premium single-serve products (approximately $97 million) and U.S. packaged coffee (approximately $42
million), as well as an increase in foodservice sales (approximately $35 million).
Operating Expenses
Cost of sales as a percentage of total net revenues decreased 80 basis points, primarily due to leverage on cost of sales
(approximately 100 basis points).
Other operating expenses as a percentage of total net revenues increased 10 basis points, primarily driven by increased
marketing (approximately 60 basis points), largely due to new premium single-serve product launches. This increase was
partially offset by lower professional fees (approximately 30 basis points) and sales leverage (approximately 20 basis points).
Income from equity investees increased $27 million, driven by higher income from our North American Coffee Partnership
joint venture, primarily due to increased sales of bottled Frappuccino® and Starbucks Doubleshot® beverages, largely driven by
new product launches and higher sales volumes.
The combination of these changes contributed to an overall increase in operating margin of 180 basis points over fiscal 2014.
Starbucks Corporation 2015 Form 10-K 29