Starbucks 2015 Annual Report Download - page 35
Download and view the complete annual report
Please find page 35 of the 2015 Starbucks annual report below. You can navigate through the pages in the report by either clicking on the pages listed below, or by using the keyword search tool below to find specific information within the annual report.-
 1
1 -
2
-
3
-
4
-
5
-
6
-
7
-
8
-
9
-
10
-
11
-
12
-
13
-
14
-
15
-
16
-
17
-
18
-
19
-
20
-
21
-
22
-
23
-
24
-
 25
25 -
 26
26 -
 27
27 -
 28
28 -
 29
29 -
 30
30 -
 31
31 -
 32
32 -
 33
33 -
 34
34 -
 35
35 -
 36
36 -
 37
37 -
 38
38 -
 39
39 -
 40
40 -
 41
41 -
 42
42 -
 43
43 -
 44
44 -
 45
45 -
46
-
47
-
48
-
49
-
50
-
51
-
52
-
53
-
54
-
55
-
56
-
57
-
58
-
59
-
60
-
61
-
62
-
63
-
64
-
65
-
66
-
67
-
68
-
69
-
70
-
71
-
72
-
73
-
74
-
75
-
76
-
77
-
78
-
79
-
80
-
81
-
82
-
83
-
84
-
85
-
86
-
87
-
88
-
89
-
90
-
91
-
92
-
93
-
94
-
95
-
96
-
97
-
98
-
99
-
100
-
101
-
102
-
103
-
104
-
105
-
106
-
107
-
108
 |
 |
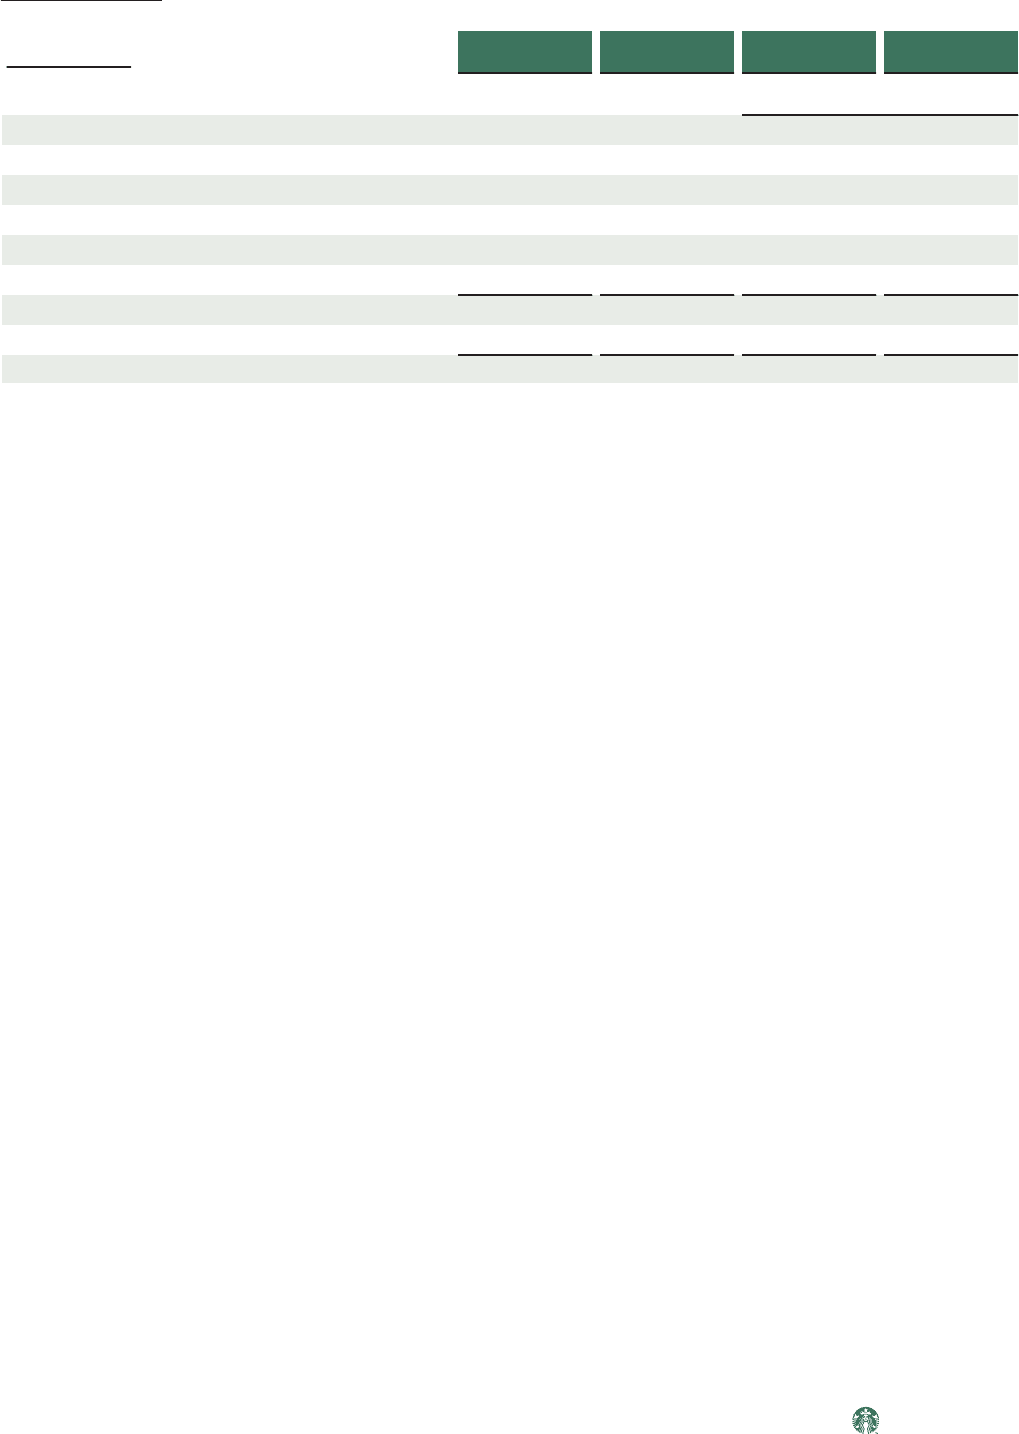
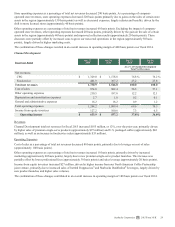
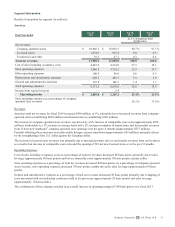
Operating Expenses
Fiscal Year Ended
Sep 28,
2014
Sep 29,
2013
Sep 28,
2014
Sep 29,
2013
% of Total
Net Revenues
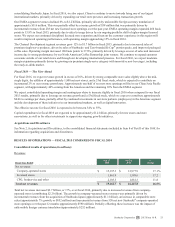
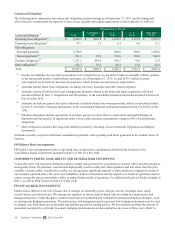
Cost of sales including occupancy costs $ 6,858.8 $ 6,382.3 41.7 % 42.9 %
Store operating expenses 4,638.2 4,286.1 28.2 28.8
Other operating expenses 457.3 431.8 2.8 2.9
Depreciation and amortization expenses 709.6 621.4 4.3 4.2
General and administrative expenses 991.3 937.9 6.0 6.3
Litigation charge/(credit) (20.2) 2,784.1 (0.1) 18.7
Total operating expenses 13,635.0 15,443.6 82.9 103.9
Income from equity investees 268.3 251.4 1.6 1.7
Operating income/(loss) $ 3,081.1 $ (325.4) 18.7% (2.2)%
Store operating expenses as a percentage of company-
operated store revenues 35.7 % 36.3 %
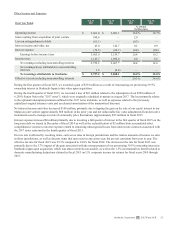
Cost of sales including occupancy costs as a percentage of total net revenues decreased 120 basis points, primarily driven by
lower commodity costs (approximately 80 basis points), mainly coffee, and sales leverage (approximately 40 basis points).
Store operating expenses as a percentage of total net revenues, and as a percentage of company-operated store revenues,
decreased 60 basis points, mainly driven by sales leverage (approximately 80 basis points).
Other operating expenses as a percentage of total net revenues decreased 10 basis points. Excluding the impact of company-
operated store revenues, other operating expenses decreased 80 basis points, primarily due to sales leverage (approximately 30
basis points).
General and administrative expenses as a percentage of total net revenues decreased 30 basis points, mainly due to lapping of
costs associated with our leadership conference held in the prior year.
The litigation charge of $2,784.1 million in fiscal 2013 reflects the charge we recorded as a result of the conclusion of the
arbitration with Kraft. This charge included $2,227.5 million in damages and $556.6 million in estimated interest and attorneys'
fees. The $20.2 million litigation credit recorded in fiscal 2014 reflects a reduction to our estimated prejudgment interest
payable associated with the Kraft arbitration as a result of paying our obligation earlier than anticipated.
Income from equity investees increased $17 million, primarily due to improved performance from our joint venture operations
in China, South Korea, and Japan, as well as improved performance from our North American Coffee Partnership joint venture,
which produces, bottles and distributes our ready-to-drink beverages.
The combination of these changes resulted in an overall increase in operating margin to 18.7% compared to (2.2)% in the prior
year period.
Starbucks Corporation 2015 Form 10-K 31