Starbucks 2015 Annual Report Download - page 27
Download and view the complete annual report
Please find page 27 of the 2015 Starbucks annual report below. You can navigate through the pages in the report by either clicking on the pages listed below, or by using the keyword search tool below to find specific information within the annual report.-
 1
1 -
2
-
3
-
4
-
5
-
6
-
7
-
8
-
9
-
10
-
11
-
12
-
13
-
14
-
15
-
16
-
 17
17 -
 18
18 -
 19
19 -
 20
20 -
 21
21 -
 22
22 -
 23
23 -
 24
24 -
 25
25 -
 26
26 -
 27
27 -
 28
28 -
 29
29 -
 30
30 -
 31
31 -
 32
32 -
 33
33 -
 34
34 -
 35
35 -
 36
36 -
 37
37 -
38
-
39
-
40
-
41
-
42
-
43
-
44
-
45
-
46
-
47
-
48
-
49
-
50
-
51
-
52
-
53
-
54
-
55
-
56
-
57
-
58
-
59
-
60
-
61
-
62
-
63
-
64
-
65
-
66
-
67
-
68
-
69
-
70
-
71
-
72
-
73
-
74
-
75
-
76
-
77
-
78
-
79
-
80
-
81
-
82
-
83
-
84
-
85
-
86
-
87
-
88
-
89
-
90
-
91
-
92
-
93
-
94
-
95
-
96
-
97
-
98
-
99
-
100
-
101
-
102
-
103
-
104
-
105
-
106
-
107
-
108
 |
 |
consolidating Starbucks Japan. In fiscal 2016, we also expect China to continue to move towards being one of our largest
international markets, primarily driven by expanding our retail store presence and increasing transaction growth.
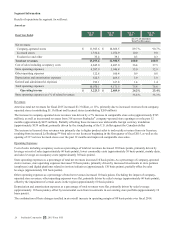
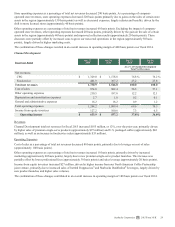
Our EMEA segment revenues declined 6% to $1.2 billion, primarily driven by unfavorable foreign currency translation of
approximately $116 million. This was partially offset by revenue growth of $38 million that was primarily driven by
incremental revenues from 238 net new licensed store openings over the past year. EMEA operating margin expanded 460 basis
points to 13.8% in fiscal 2015, primarily due to sales leverage driven by our ongoing portfolio shift to higher-margin licensed
stores. We expect our continued disciplined licensed store expansion and focus on the customer experience in this region will
result in improved operating performance, with operating margin approaching 15% in fiscal 2016.
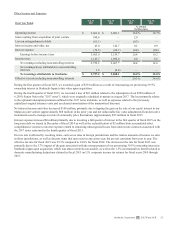
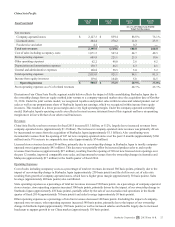
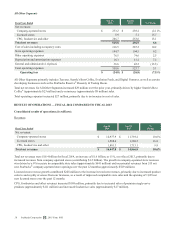
The Channel Development segment revenues grew 12% to $1.7 billion in fiscal 2015, primarily due to increased sales of
premium single-serve products, driven by sales of Starbucks- and Tazo-branded K-Cup® portion packs, and improved packaged
coffee sales. Operating margin increased 180 basis points to 37.8%, primarily driven by leverage on cost of sales and increased
income due to strong performance by our North American Coffee Partnership joint venture. We continue to expand customer
occasions outside of our retail stores and through our developing international presence. For fiscal 2016, we expect moderate
margin expansion primarily driven by growing our premium single-serve category with innovative new beverages, including
the ready-to-drink market.
Fiscal 2016 — The View Ahead
For fiscal 2016, we expect revenue growth in excess of 10%, driven by strong comparable store sales slightly above the mid-
single digits, the addition of approximately 1,800 net new stores, and a 53rd fiscal week, which is expected to contribute an
incremental 2% to our revenue growth rate. Approximately one-half of net new store openings will be in our China/Asia Pacific
segment, with approximately 40% coming from the Americas and the remaining 10% from the EMEA segment.
We expect consolidated operating margin and earnings per share to increase slightly in fiscal 2016 when compared to our fiscal
2015 results, primarily due to leverage on revenue growth and a 53rd fiscal week, which we expect to contribute approximately
$0.06 to earnings per share, partially offset by continued investments in our store partners (employees) in the Americas segment
and the development of these initiatives in our international markets, as well as digital innovation.
The effective tax rate for fiscal 2016 is expected to be between 34% to 35%.
Capital expenditures in fiscal 2016 are expected to be approximately $1.4 billion, primarily for new stores and store
renovations, as well as for other investments to support our ongoing growth initiatives.
Acquisitions and Divestitures
See Note 2, Acquisitions and Divestitures, to the consolidated financial statements included in Item 8 of Part II of this 10-K for
information regarding acquisitions and divestitures.
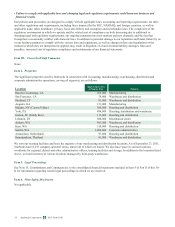
RESULTS OF OPERATIONS — FISCAL 2015 COMPARED TO FISCAL 2014
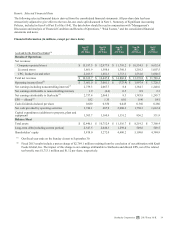
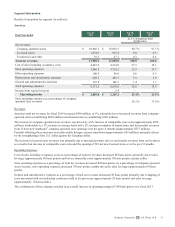
Consolidated results of operations (in millions):
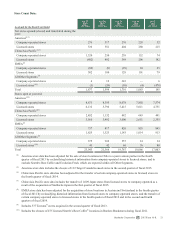
Revenues
Fiscal Year Ended
Sep 27,
2015
Sep 28,
2014
%
Change
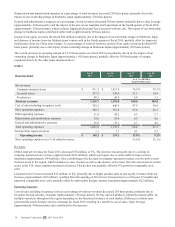
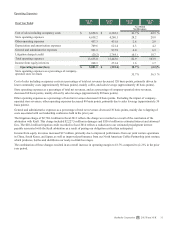
Net revenues:
Company-operated stores $ 15,197.3 $ 12,977.9 17.1 %
Licensed stores 1,861.9 1,588.6 17.2
CPG, foodservice and other 2,103.5 1,881.3 11.8
Total net revenues $ 19,162.7 $ 16,447.8 16.5%
Total net revenues increased $2.7 billion, or 17%, over fiscal 2014, primarily due to increased revenues from company-
operated stores (contributing $2.2 billion). The growth in company-operated store revenues was primarily driven by
incremental revenues from the acquisition of Starbucks Japan (approximately $1.1 billion), an increase in comparable store
sales (approximately 7% growth, or $852 million) and incremental revenues from 550 net new Starbucks® company-operated
store openings over the past 12 months (approximately $590 million). Partially offsetting these increases was the impact of
unfavorable foreign currency translation (approximately $252 million).
Starbucks Corporation 2015 Form 10-K 23