Starbucks 2015 Annual Report Download - page 54
Download and view the complete annual report
Please find page 54 of the 2015 Starbucks annual report below. You can navigate through the pages in the report by either clicking on the pages listed below, or by using the keyword search tool below to find specific information within the annual report.-
 1
1 -
2
-
3
-
4
-
5
-
6
-
7
-
8
-
9
-
10
-
11
-
12
-
13
-
14
-
15
-
16
-
17
-
18
-
19
-
20
-
21
-
22
-
23
-
24
-
25
-
26
-
27
-
28
-
29
-
30
-
31
-
32
-
33
-
34
-
35
-
36
-
37
-
38
-
39
-
40
-
41
-
42
-
43
-
 44
44 -
 45
45 -
 46
46 -
 47
47 -
 48
48 -
 49
49 -
 50
50 -
 51
51 -
 52
52 -
 53
53 -
 54
54 -
 55
55 -
 56
56 -
 57
57 -
 58
58 -
 59
59 -
 60
60 -
 61
61 -
 62
62 -
 63
63 -
 64
64 -
65
-
66
-
67
-
68
-
69
-
70
-
71
-
72
-
73
-
74
-
75
-
76
-
77
-
78
-
79
-
80
-
81
-
82
-
83
-
84
-
85
-
86
-
87
-
88
-
89
-
90
-
91
-
92
-
93
-
94
-
95
-
96
-
97
-
98
-
99
-
100
-
101
-
102
-
103
-
104
-
105
-
106
-
107
-
108
 |
 |

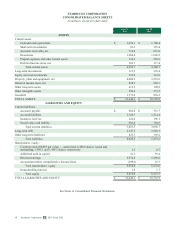
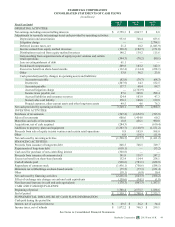
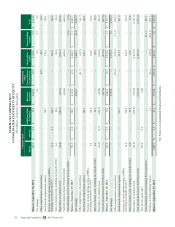
STARBUCKS CORPORATION
CONSOLIDATED STATEMENTS OF EQUITY
(in millions, except per share data)
Common Stock
Additional Paid-
in Capital
Retained
Earnings
Accumulated
Other
Comprehensive
Income/(Loss)
Shareholders’
Equity
Noncontrolling
Interest Total
Shares Amount
Balance, September 30, 2012 749.3 $ 0.7 $ 39.4 $ 5,046.2 $ 22.7 $ 5,109.0 $ 5.5 $ 5,114.5
Net earnings — — — 8.3 — 8.3 0.5 8.8
Other comprehensive income/(loss) 44.3 44.3 — 44.3
Stock-based compensation expense — — 144.1 — — 144.1 — 144.1
Exercise of stock options/vesting of RSUs,
including tax benefit of $259.9 14.4 0.1 366.7 — — 366.8 — 366.8
Sale of common stock, including tax benefit of $0.2 0.3 — 20.4 — — 20.4 — 20.4
Repurchase of common stock (10.8) — (288.5) (255.6) — (544.1) — (544.1)
Cash dividends declared, $0.445 per share — — — (668.6) — (668.6) — (668.6)
Noncontrolling interest resulting from divestiture — — — — — — (3.9) (3.9)
Balance, September 29, 2013 753.2 $ 0.8 $ 282.1 $ 4,130.3 $ 67.0 $ 4,480.2 $ 2.1 $ 4,482.3
Net earnings — — — 2,068.1 — 2,068.1 (0.4) 2,067.7
Other comprehensive income/(loss) (41.7) (41.7) — (41.7)
Stock-based compensation expense — — 185.1 — — 185.1 — 185.1
Exercise of stock options/vesting of RSUs,
including tax benefit of $114.8 6.5 — 154.8 — — 154.8 — 154.8
Sale of common stock, including tax benefit of $0.2 0.3 — 22.3 — — 22.3 — 22.3
Repurchase of common stock (10.5) (0.1) (604.9) (164.8) — (769.8) — (769.8)
Cash dividends declared, $0.550 per share — — — (827.0) — (827.0) — (827.0)
Balance, September 28, 2014 749.5 $ 0.7 $ 39.4 $ 5,206.6 $ 25.3 $ 5,272.0 $ 1.7 $ 5,273.7
Net earnings — — — 2,757.4 — 2,757.4 1.9 2,759.3
Other comprehensive income/(loss) (193.6) (193.6) (31.1) (224.7)
Stock-based compensation expense — — 211.7 — — 211.7 — 211.7
Exercise of stock options/vesting of RSUs,
including tax benefit of $131.3 14.6 — 224.4 — — 224.4 — 224.4
Sale of common stock, including tax benefit of $0.2 0.6 — 23.5 — — 23.5 — 23.5
Repurchase of common stock (29.0) — (459.6) (972.2) — (1,431.8) — (1,431.8)
Cash dividends declared, $0.680 per share — — — (1,016.2) — (1,016.2) — (1,016.2)
Two-for-one stock split 749.4 0.8 — (0.8) — — — —
Noncontrolling interest resulting from acquisition — — — — — — 411.1 411.1
Purchase of noncontrolling interest — — 1.7 — (31.1) (29.4) (381.7) (411.1)
Balance, September 27, 2015 1,485.1 $ 1.5 $ 41.1 $ 5,974.8 $ (199.4) $ 5,818.0 $ 1.8 $ 5,819.8
See Notes to Consolidated Financial Statements.
50 Starbucks Corporation 2015 Form 10-K