Starbucks 2015 Annual Report Download - page 26
Download and view the complete annual report
Please find page 26 of the 2015 Starbucks annual report below. You can navigate through the pages in the report by either clicking on the pages listed below, or by using the keyword search tool below to find specific information within the annual report.-
 1
1 -
2
-
3
-
4
-
5
-
6
-
7
-
8
-
9
-
10
-
11
-
12
-
13
-
14
-
15
-
 16
16 -
 17
17 -
 18
18 -
 19
19 -
 20
20 -
 21
21 -
 22
22 -
 23
23 -
 24
24 -
 25
25 -
 26
26 -
 27
27 -
 28
28 -
 29
29 -
 30
30 -
 31
31 -
 32
32 -
 33
33 -
 34
34 -
 35
35 -
 36
36 -
37
-
38
-
39
-
40
-
41
-
42
-
43
-
44
-
45
-
46
-
47
-
48
-
49
-
50
-
51
-
52
-
53
-
54
-
55
-
56
-
57
-
58
-
59
-
60
-
61
-
62
-
63
-
64
-
65
-
66
-
67
-
68
-
69
-
70
-
71
-
72
-
73
-
74
-
75
-
76
-
77
-
78
-
79
-
80
-
81
-
82
-
83
-
84
-
85
-
86
-
87
-
88
-
89
-
90
-
91
-
92
-
93
-
94
-
95
-
96
-
97
-
98
-
99
-
100
-
101
-
102
-
103
-
104
-
105
-
106
-
107
-
108
 |
 |

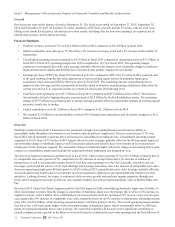
Item 7. Management’s Discussion and Analysis of Financial Condition and Results of Operations
General
Our fiscal year ends on the Sunday closest to September 30. The fiscal years ended on September 27, 2015, September 28,
2014 and September 29, 2013 all included 52 weeks. Starbucks 2016 fiscal year will include 53 weeks, with the 53rd week
falling in our fourth fiscal quarter. All references to store counts, including data for new store openings, are reported net of
related store closures, unless otherwise noted.
Financial Highlights
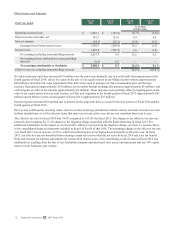
• Total net revenues increased 17% to $19.2 billion in fiscal 2015 compared to $16.4 billion in fiscal 2014.
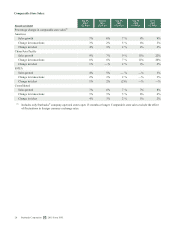
• Global comparable store sales grew 7% driven by a 4% increase in average ticket and a 3% increase in the number of
transactions.
• Consolidated operating income increased to $3.6 billion in fiscal 2015 compared to operating income of $3.1 billion in
fiscal 2014. Fiscal 2015 operating margin was 18.8% compared to 18.7% in fiscal 2014. The operating margin
expansion was primarily driven by sales leverage, partially offset by the impact of our ownership change in Starbucks
Japan and increased salaries and benefits due to increased store partner (employee) investments.
• Earnings per share ("EPS") for fiscal 2015 increased to $1.82, compared to EPS of $1.35 in fiscal 2014, primarily due
to the gain resulting from the fair value adjustment of our preexisting equity interest in Starbucks Japan upon
acquisition, which increased EPS by $0.26 per share in fiscal 2015. The remaining increase was primarily due to
improved sales leverage and the incremental tax benefit related to domestic manufacturing deductions claimed for the
current year and on U.S. corporate income tax returns for fiscal years 2010 through 2014.
• Cash flows from operations were $3.7 billion in fiscal 2015 compared to $607.8 million in fiscal 2014. The increase
was primarily driven by lapping the prior year payment of $2.8 billion for the Kraft arbitration matter. The remaining
change of $377 million was primarily due to strong earnings, partially offset by unfavorable changes in working capital
accounts, mainly due to timing.
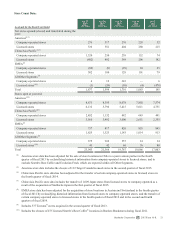
• Capital expenditures were $1.3 billion in fiscal 2015 compared to $1.2 billion in fiscal 2014.
• We returned $2.4 billion to our shareholders in fiscal 2015 through share repurchases and dividends compared to $1.6
billion in fiscal 2014.
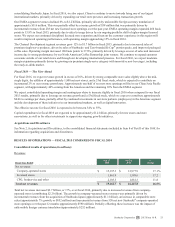
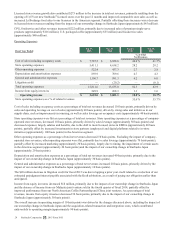
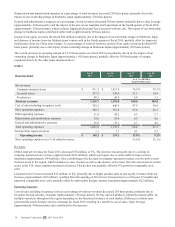
Overview
Starbucks results for fiscal 2015 demonstrate the continued strength of our global business model and our ability to
successfully make disciplined investments in our business and our partners (employees). Our net revenues grew 17% over
fiscal 2014 and all reportable segments drove an increase in consolidated operating income. Consolidated operating margin
expanded to 18.8% from 18.7% in fiscal 2014, largely driven by sales leverage, partially offset by the 90 basis point impact of
our ownership change in Starbucks Japan as well as increased salaries and benefits due to investments in our store partners
(employees) in the Americas segment. The ownership change in Starbucks Japan reflects the change in accounting from a joint
venture to a consolidated market and includes the acquisition-related transaction and integration costs.
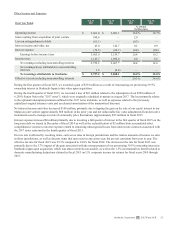
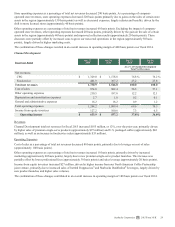
The Americas segment continued to perform well in fiscal 2015, with revenues growing 11% to $13.3 billion, primarily driven
by comparable store sales growth of 7%, comprised of a 4% increase in average ticket and a 3% increase in number of
transactions, as well as incremental revenues from 612 net new store openings over the last 12 months. Growth in our core
beverages, paired with the success of our food offerings and beverage innovation, drove the increase in comparable store sales.
Americas operating margin grew 80 basis points to 24.2% in fiscal 2015, primarily driven by sales leverage, partially offset by
increased salaries and benefits due to investments in our store partners (employees) and digital platforms related to in-store
initiatives. Looking forward, we expect to continue to drive revenue growth and moderate margin expansion through new
stores and leveraging investments in both our store partners (employees) and our digital platforms, such as Mobile Order and
Pay.
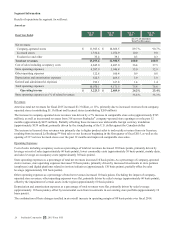
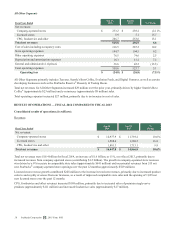
Our fiscal 2015 China/Asia Pacific segment results reflect the impact of fully consolidating Starbucks Japan since October 31,
2014. Incremental revenues from the change in ownership of Starbucks Japan were the primary driver of the 112% increase in
segment revenues, to $2.4 billion. Also contributing were increased sales from the opening of 767 net new stores over the past
year, along with a 9% increase in comparable store sales, primarily driven by an 8% increase in transactions. Operating income
grew 34%, to $501 million, while operating margin declined 1,210 basis points to 20.9%. The overall operating margin decline
was due to the 1,410 basis point impact of the ownership change in Starbucks Japan, which was partially offset by 200 basis
points of expansion primarily due to sales leverage. We expect this segment will become a more significant contributor to
overall company revenue growth in the future as we look forward to continued net new store openings and the first full year of
22 Starbucks Corporation 2015 Form 10-K