Starbucks 2015 Annual Report Download - page 31
Download and view the complete annual report
Please find page 31 of the 2015 Starbucks annual report below. You can navigate through the pages in the report by either clicking on the pages listed below, or by using the keyword search tool below to find specific information within the annual report.-
 1
1 -
2
-
3
-
4
-
5
-
6
-
7
-
8
-
9
-
10
-
11
-
12
-
13
-
14
-
15
-
16
-
17
-
18
-
19
-
20
-
 21
21 -
 22
22 -
 23
23 -
 24
24 -
 25
25 -
 26
26 -
 27
27 -
 28
28 -
 29
29 -
 30
30 -
 31
31 -
 32
32 -
 33
33 -
 34
34 -
 35
35 -
 36
36 -
 37
37 -
 38
38 -
 39
39 -
 40
40 -
 41
41 -
42
-
43
-
44
-
45
-
46
-
47
-
48
-
49
-
50
-
51
-
52
-
53
-
54
-
55
-
56
-
57
-
58
-
59
-
60
-
61
-
62
-
63
-
64
-
65
-
66
-
67
-
68
-
69
-
70
-
71
-
72
-
73
-
74
-
75
-
76
-
77
-
78
-
79
-
80
-
81
-
82
-
83
-
84
-
85
-
86
-
87
-
88
-
89
-
90
-
91
-
92
-
93
-
94
-
95
-
96
-
97
-
98
-
99
-
100
-
101
-
102
-
103
-
104
-
105
-
106
-
107
-
108
 |
 |

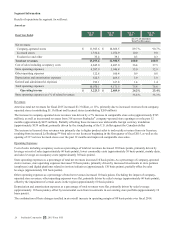
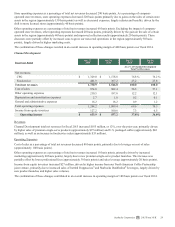
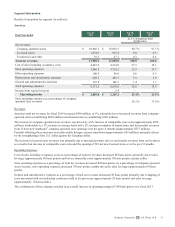
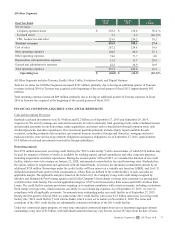
China/Asia Pacific
Fiscal Year Ended
Sep 27,
2015
Sep 28,
2014
Sep 27,
2015
Sep 28,
2014
As a % of China/Asia Pacific
Total Net Revenues
Net revenues:
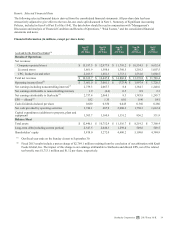
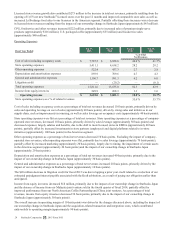
Company-operated stores $ 2,127.3 $ 859.4 88.8 % 76.1 %
Licensed stores 264.4 270.2 11.0 23.9
Foodservice and other 4.2 —0.2 —
Total net revenues 2,395.9 1,129.6 100.0 100.0
Cost of sales including occupancy costs 1,071.5 547.4 44.7 48.5
Store operating expenses 609.8 221.1 25.5 19.6
Other operating expenses 62.2 48.0 2.6 4.2
Depreciation and amortization expenses 150.7 46.1 6.3 4.1
General and administrative expenses 120.8 58.5 5.0 5.2
Total operating expenses 2,015.0 921.1 84.1 81.5
Income from equity investees 119.6 164.0 5.0 14.5
Operating income $ 500.5 $ 372.5 20.9% 33.0%
Store operating expenses as a % of related revenues 28.7 % 25.7 %
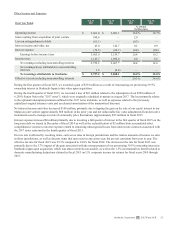
Discussion of our China/Asia Pacific segment results below reflects the impact of fully consolidating Starbucks Japan due to
the ownership change from an equity method joint venture to a company-operated market since the acquisition date of October
31, 2014. Under the joint venture model, we recognized royalties and product sales within revenue and related product cost of
sales as well as our proportionate share of Starbucks Japan's net earnings, which we recognized within income from equity
investees. This resulted in a lower gross margin and a very high operating margin. Under the company-operated ownership
model, Starbucks Japan's operating results are reflected in most income statement lines of this segment and have an operating
margin more in line with that of our other retail businesses.
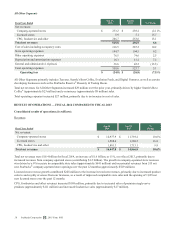
Revenues
China/Asia Pacific total net revenues for fiscal 2015 increased $1.3 billion, or 112%, largely due to increased revenues from
company-operated stores (approximately $1.3 billion). The increase in company-operated store revenues was primarily driven
by incremental revenues from the acquisition of Starbucks Japan (approximately $1.1 billion). Also contributing were
incremental revenues from the opening of 247 net new company-operated stores over the past 12 months (approximately $160
million) and a 9% increase in comparable store sales (approximately $74 million).
Licensed store revenues decreased $6 million, primarily due to our ownership change in Starbucks Japan to mostly company-
operated stores (approximately $45 million). This decrease was partially offset by increased product sales to and royalty
revenues from licensees (approximately $27 million), resulting from the opening of 520 net new licensed store openings over
the past 12 months, improved comparable store sales, and incremental revenues from the ownership changes in Australia and
Malaysia (approximately $17 million) in the fourth quarter of fiscal 2014.
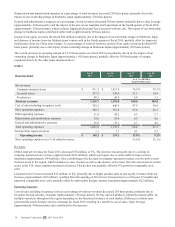
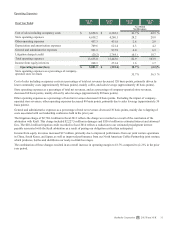
Operating Expenses
Cost of sales including occupancy costs as a percentage of total net revenues decreased 380 basis points, primarily due to the
impact of our ownership change in Starbucks Japan (approximately 230 basis points) and the shift in our cost of sales mix
resulting from growth of company-operated stores, which have a higher gross margin (approximately 50 basis points). Sales
leverage (approximately 40 basis points) also contributed.
Store operating expenses as a percentage of total net revenues increased 590 basis points. As a percentage of company-operated
store revenues, store operating expenses increased 300 basis points, primarily driven by the impact of our ownership change in
Starbucks Japan (approximately 410 basis points), partially offset by the sale of our Australia retail operations in the fourth
quarter of fiscal 2014 (approximately 70 basis points) and sales leverage (approximately 50 basis points).
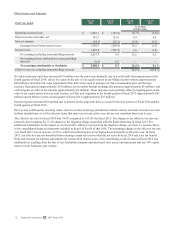
Other operating expenses as a percentage of total net revenues decreased 160 basis points. Excluding the impact of company-
operated store revenues, other operating expenses increased 540 basis points, primarily due to the impact of our ownership
change in Starbucks Japan (approximately 350 basis points) as well as increased salaries and benefits largely due to increased
headcount to support growth in our China market (approximately 150 basis points).
Starbucks Corporation 2015 Form 10-K 27