Starbucks 2015 Annual Report Download - page 39
Download and view the complete annual report
Please find page 39 of the 2015 Starbucks annual report below. You can navigate through the pages in the report by either clicking on the pages listed below, or by using the keyword search tool below to find specific information within the annual report.-
 1
1 -
2
-
3
-
4
-
5
-
6
-
7
-
8
-
9
-
10
-
11
-
12
-
13
-
14
-
15
-
16
-
17
-
18
-
19
-
20
-
21
-
22
-
23
-
24
-
25
-
26
-
27
-
28
-
 29
29 -
 30
30 -
 31
31 -
 32
32 -
 33
33 -
 34
34 -
 35
35 -
 36
36 -
 37
37 -
 38
38 -
 39
39 -
 40
40 -
 41
41 -
 42
42 -
 43
43 -
 44
44 -
 45
45 -
 46
46 -
 47
47 -
 48
48 -
 49
49 -
50
-
51
-
52
-
53
-
54
-
55
-
56
-
57
-
58
-
59
-
60
-
61
-
62
-
63
-
64
-
65
-
66
-
67
-
68
-
69
-
70
-
71
-
72
-
73
-
74
-
75
-
76
-
77
-
78
-
79
-
80
-
81
-
82
-
83
-
84
-
85
-
86
-
87
-
88
-
89
-
90
-
91
-
92
-
93
-
94
-
95
-
96
-
97
-
98
-
99
-
100
-
101
-
102
-
103
-
104
-
105
-
106
-
107
-
108
 |
 |
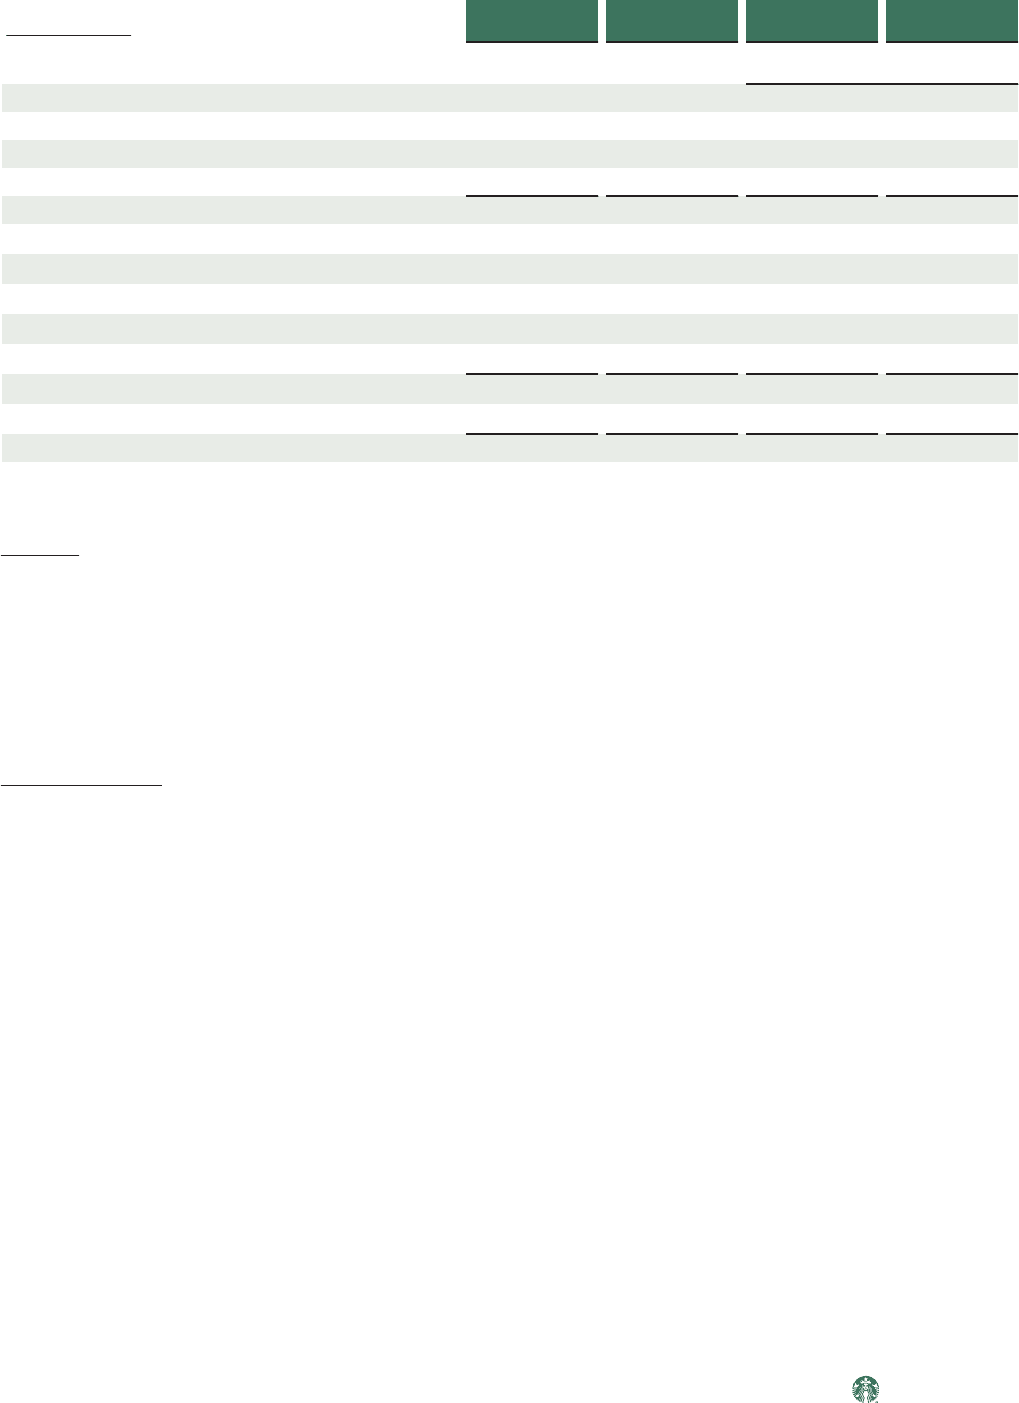
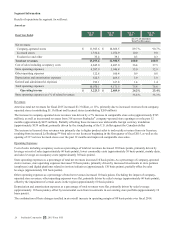
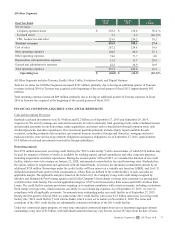
EMEA
Fiscal Year Ended
Sep 28,
2014
Sep 29,
2013
Sep 28,
2014
Sep 29,
2013
As a % of EMEA Total
Net Revenues
Net revenues:
Company-operated stores $ 1,013.8 $ 932.8 78.3 % 80.4 %
Licensed stores 238.4 190.3 18.4 16.4
Foodservice 42.6 36.9 3.3 3.2
Total net revenues 1,294.8 1,160.0 100.0 100.0
Cost of sales including occupancy costs 646.8 590.9 50.0 50.9
Store operating expenses 365.8 339.4 28.3 29.3
Other operating expenses 48.2 38.5 3.7 3.3
Depreciation and amortization expenses 59.4 55.5 4.6 4.8
General and administrative expenses 59.1 71.9 4.6 6.2
Total operating expenses 1,179.3 1,096.2 91.1 94.5
Income from equity investees 3.7 0.4 0.3 —
Operating income $ 119.2 $ 64.2 9.2% 5.5%
Store operating expenses as a percentage of company-
operated store revenues 36.1 % 36.4 %
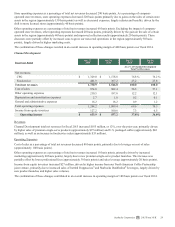
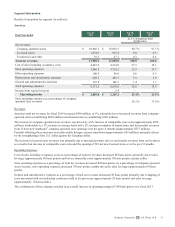
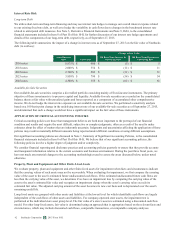
Revenues
EMEA total net revenues for fiscal 2014 increased $135 million, or 12%, over the prior year primarily due to an increase in
company-operated stores revenues (approximately $81 million). This increase was primarily driven by favorable foreign
currency translation (approximately $47 million) and a 5% increase in comparable store sales (approximately $42 million),
attributable to a 3% increase in number of transactions and a 2% increase in average ticket.
Licensed store revenues grew $48 million, or 25%, primarily due to increased product and equipment sales to and royalty
revenues from our licensees, primarily resulting from the opening of 180 net new licensed stores over the past 12 months and
improved comparable store sales.
Operating Expenses
Cost of sales including occupancy costs as a percentage of total net revenues decreased 90 basis points, primarily driven by
lower coffee costs (approximately 50 basis points), sales leverage (approximately 40 basis points) and favorable foreign
currency fluctuations (approximately 40 basis points). This favorability was partially offset by lapping a reduction to the
estimated asset retirement obligations of our store leases in the region in fiscal 2013 (approximately 60 basis points).
Store operating expenses as a percentage of total net revenues decreased 100 basis points primarily due to sales leverage from
more licensed stores in the region compared to the prior year. As a percentage of company-operated store revenues, store
operating expenses decreased 30 basis points mainly due to sales leverage.
Other operating expenses as a percentage of total net revenues increased 40 basis points over fiscal 2013. Excluding the impact
of company-operated store revenues, other operating expenses increased 30 basis points, driven by increased costs to grow our
non-retail operations in the region (approximately 40 basis points).
General and administrative expenses as a percentage of total net revenues decreased 160 basis points, primarily due to sales
leverage and reduced support costs, largely driven by the shift to more licensed stores.
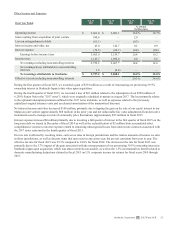
The combination of these changes resulted in an overall increase in operating margin of 370 basis points over fiscal 2013.
Starbucks Corporation 2015 Form 10-K 35