Starbucks 2015 Annual Report Download - page 30
Download and view the complete annual report
Please find page 30 of the 2015 Starbucks annual report below. You can navigate through the pages in the report by either clicking on the pages listed below, or by using the keyword search tool below to find specific information within the annual report.-
 1
1 -
2
-
3
-
4
-
5
-
6
-
7
-
8
-
9
-
10
-
11
-
12
-
13
-
14
-
15
-
16
-
17
-
18
-
19
-
 20
20 -
 21
21 -
 22
22 -
 23
23 -
 24
24 -
 25
25 -
 26
26 -
 27
27 -
 28
28 -
 29
29 -
 30
30 -
 31
31 -
 32
32 -
 33
33 -
 34
34 -
 35
35 -
 36
36 -
 37
37 -
 38
38 -
 39
39 -
 40
40 -
41
-
42
-
43
-
44
-
45
-
46
-
47
-
48
-
49
-
50
-
51
-
52
-
53
-
54
-
55
-
56
-
57
-
58
-
59
-
60
-
61
-
62
-
63
-
64
-
65
-
66
-
67
-
68
-
69
-
70
-
71
-
72
-
73
-
74
-
75
-
76
-
77
-
78
-
79
-
80
-
81
-
82
-
83
-
84
-
85
-
86
-
87
-
88
-
89
-
90
-
91
-
92
-
93
-
94
-
95
-
96
-
97
-
98
-
99
-
100
-
101
-
102
-
103
-
104
-
105
-
106
-
107
-
108
 |
 |
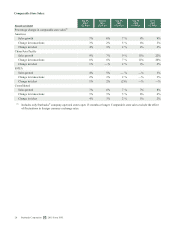
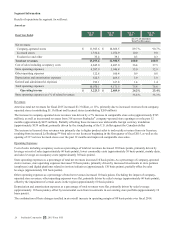
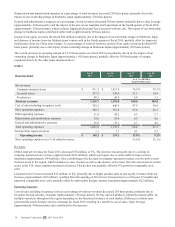
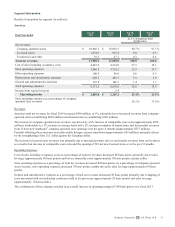
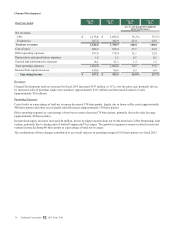
Segment Information
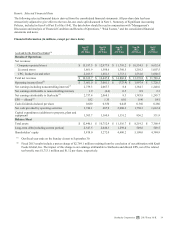
Results of operations by segment (in millions):
Americas
Fiscal Year Ended
Sep 27,
2015
Sep 28,
2014
Sep 27,
2015
Sep 28,
2014
As a % of Americas
Total Net Revenues
Net revenues:
Company-operated stores $ 11,925.6 $ 10,866.5 89.7 % 90.7 %
Licensed stores 1,334.4 1,074.9 10.0 9.0
Foodservice and other 33.4 39.1 0.3 0.3
Total net revenues 13,293.4 11,980.5 100.0 100.0
Cost of sales including occupancy costs 4,845.0 4,487.0 36.4 37.5
Store operating expenses 4,387.9 3,946.8 33.0 32.9
Other operating expenses 122.8 100.4 0.9 0.8
Depreciation and amortization expenses 522.3 469.5 3.9 3.9
General and administrative expenses 192.1 167.8 1.4 1.4
Total operating expenses 10,070.1 9,171.5 75.8 76.6
Operating income $ 3,223.3 $ 2,809.0 24.2% 23.4%
Store operating expenses as a % of related revenues 36.8 % 36.3 %
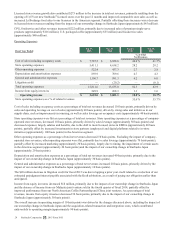
Revenues
Americas total net revenues for fiscal 2015 increased $1.3 billion, or 11%, primarily due to increased revenues from company-
operated stores (contributing $1.1 billion) and licensed stores (contributing $260 million).
The increase in company-operated store revenues was driven by a 7% increase in comparable store sales (approximately $745
million), as well as incremental revenues from 318 net new Starbucks® company-operated store openings over the past 12
months (approximately $455 million). Partially offsetting these increases was unfavorable foreign currency translation
(approximately $139 million), primarily driven by the strengthening of the U.S. dollar against the Canadian dollar.
The increase in licensed store revenues was primarily due to higher product sales to and royalty revenues from our licensees,
resulting from increased La Boulange™ food sales to our licensees beginning in the first quarter of fiscal 2015, as well as the
opening of 317 net new licensed stores over the past 12 months and improved comparable store sales.
Operating Expenses
Cost of sales including occupancy costs as a percentage of total net revenues decreased 110 basis points, primarily driven by
leverage on cost of sales (approximately 60 basis points), lower commodity costs (approximately 30 basis points), mainly dairy,
and sales leverage on occupancy costs (approximately 30 basis points).
Store operating expenses as a percentage of total net revenues increased 10 basis points. As a percentage of company-operated
store revenues, store operating expenses increased 50 basis points, primarily driven by increased investments in store partners
(employees) and digital platforms related to in-store initiatives (approximately 130 basis points), partially offset by sales
leverage (approximately 100 basis points).
Other operating expenses as a percentage of total net revenues increased 10 basis points. Excluding the impact of company-
operated store revenues, other operating expenses were flat, primarily driven by sales leverage (approximately 60 basis points),
offset by the impairment of certain assets in the region (approximately 60 basis points).
Depreciation and amortization expenses as a percentage of total revenues were flat, primarily driven by sales leverage
(approximately 10 basis points), offset by incremental costs from investments in our existing store portfolio (approximately 10
basis points).
The combination of these changes resulted in an overall increase in operating margin of 80 basis points over fiscal 2014.
26 Starbucks Corporation 2015 Form 10-K