Starbucks 2015 Annual Report Download - page 23
Download and view the complete annual report
Please find page 23 of the 2015 Starbucks annual report below. You can navigate through the pages in the report by either clicking on the pages listed below, or by using the keyword search tool below to find specific information within the annual report.-
 1
1 -
2
-
3
-
4
-
5
-
6
-
7
-
8
-
9
-
10
-
11
-
12
-
 13
13 -
 14
14 -
 15
15 -
 16
16 -
 17
17 -
 18
18 -
 19
19 -
 20
20 -
 21
21 -
 22
22 -
 23
23 -
 24
24 -
 25
25 -
 26
26 -
 27
27 -
 28
28 -
 29
29 -
 30
30 -
 31
31 -
 32
32 -
 33
33 -
34
-
35
-
36
-
37
-
38
-
39
-
40
-
41
-
42
-
43
-
44
-
45
-
46
-
47
-
48
-
49
-
50
-
51
-
52
-
53
-
54
-
55
-
56
-
57
-
58
-
59
-
60
-
61
-
62
-
63
-
64
-
65
-
66
-
67
-
68
-
69
-
70
-
71
-
72
-
73
-
74
-
75
-
76
-
77
-
78
-
79
-
80
-
81
-
82
-
83
-
84
-
85
-
86
-
87
-
88
-
89
-
90
-
91
-
92
-
93
-
94
-
95
-
96
-
97
-
98
-
99
-
100
-
101
-
102
-
103
-
104
-
105
-
106
-
107
-
108
 |
 |
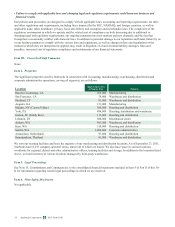
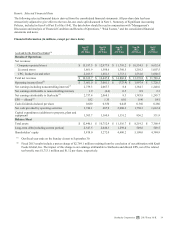
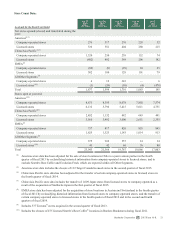
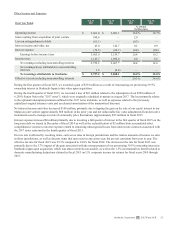
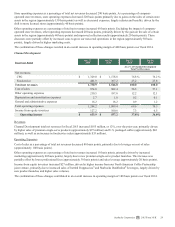
Item 6. Selected Financial Data
The following selected financial data is derived from the consolidated financial statements. All per-share data has been
retroactively adjusted to give effect to the two-for-one stock split discussed in Note 1, Summary of Significant Accounting
Policies, included in Item 8 of Part II of this 10-K. The data below should be read in conjunction with "Management’s
Discussion and Analysis of Financial Condition and Results of Operations," "Risk Factors," and the consolidated financial
statements and notes.
Financial Information (in millions, except per share data):
As of and for the Fiscal Year Ended (1)
Sep 27,
2015
(52 Wks)
Sep 28,
2014
(52 Wks)
Sep 29,
2013
(52 Wks)
Sep 30,
2012
(52 Wks)
Oct 2,
2011
(52 Wks)
Results of Operations
Net revenues:
Company-operated stores $ 15,197.3 $ 12,977.9 $ 11,793.2 $ 10,534.5 $ 9,632.4
Licensed stores 1,861.9 1,588.6 1,360.5 1,210.3 1,007.5
CPG, foodservice and other 2,103.5 1,881.3 1,713.1 1,532.0 1,060.5
Total net revenues $ 19,162.7 $ 16,447.8 $ 14,866.8 $ 13,276.8 $ 11,700.4
Operating income/(loss)(2) $ 3,601.0 $ 3,081.1 $ (325.4) $ 1,997.4 $ 1,728.5
Net earnings including noncontrolling interests(2) 2,759.3 2,067.7 8.8 1,384.7 1,248.0
Net earnings attributable to noncontrolling interests 1.9 (0.4) 0.5 0.9 2.3
Net earnings attributable to Starbucks(2) 2,757.4 2,068.1 8.3 1,383.8 1,245.7
EPS — diluted(2) 1.82 1.35 0.01 0.90 0.81
Cash dividends declared per share 0.680 0.550 0.445 0.360 0.280
Net cash provided by operating activities 3,749.1 607.8 2,908.3 1,750.3 1,612.4
Capital expenditures (additions to property, plant and
equipment) 1,303.7 1,160.9 1,151.2 856.2 531.9
Balance Sheet
Total assets $ 12,446.1 $ 10,752.9 $ 11,516.7 $ 8,219.2 $ 7,360.4
Long-term debt (including current portion) 2,347.5 2,048.3 1,299.4 549.6 549.5
Shareholders’ equity 5,818.0 5,272.0 4,480.2 5,109.0 4,384.9
(1) Our fiscal year ends on the Sunday closest to September 30.
(2) Fiscal 2013 results include a pretax charge of $2,784.1 million resulting from the conclusion of our arbitration with Kraft
Foods Global, Inc. The impact of this charge to net earnings attributable to Starbucks and diluted EPS, net of the related
tax benefit, was $1,713.1 million and $1.12 per share, respectively.
Starbucks Corporation 2015 Form 10-K 19