Starbucks 2015 Annual Report Download - page 28
Download and view the complete annual report
Please find page 28 of the 2015 Starbucks annual report below. You can navigate through the pages in the report by either clicking on the pages listed below, or by using the keyword search tool below to find specific information within the annual report.-
 1
1 -
2
-
3
-
4
-
5
-
6
-
7
-
8
-
9
-
10
-
11
-
12
-
13
-
14
-
15
-
16
-
17
-
 18
18 -
 19
19 -
 20
20 -
 21
21 -
 22
22 -
 23
23 -
 24
24 -
 25
25 -
 26
26 -
 27
27 -
 28
28 -
 29
29 -
 30
30 -
 31
31 -
 32
32 -
 33
33 -
 34
34 -
 35
35 -
 36
36 -
 37
37 -
 38
38 -
39
-
40
-
41
-
42
-
43
-
44
-
45
-
46
-
47
-
48
-
49
-
50
-
51
-
52
-
53
-
54
-
55
-
56
-
57
-
58
-
59
-
60
-
61
-
62
-
63
-
64
-
65
-
66
-
67
-
68
-
69
-
70
-
71
-
72
-
73
-
74
-
75
-
76
-
77
-
78
-
79
-
80
-
81
-
82
-
83
-
84
-
85
-
86
-
87
-
88
-
89
-
90
-
91
-
92
-
93
-
94
-
95
-
96
-
97
-
98
-
99
-
100
-
101
-
102
-
103
-
104
-
105
-
106
-
107
-
108
 |
 |
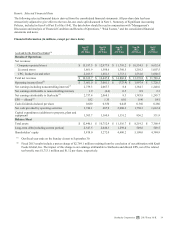
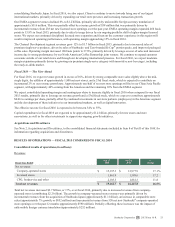
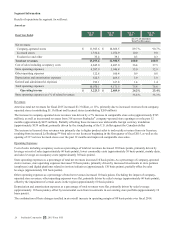
Licensed store revenue growth also contributed $273 million to the increase in total net revenues, primarily resulting from the
opening of 1,075 net new Starbucks® licensed stores over the past 12 months and improved comparable store sales as well as
increased La Boulange food sales to our licensees in the Americas segment. Partially offsetting these increases was a decrease
in licensed store revenues resulting from the impact of our ownership change in Starbucks Japan (approximately $45 million).
CPG, foodservice and other revenues increased $222 million, primarily due to increased sales of premium single-serve
products (approximately $116 million), U.S. packaged coffee (approximately $55 million) and foodservice sales
(approximately $40 million).
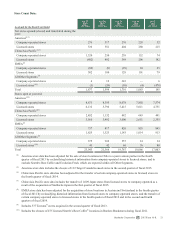
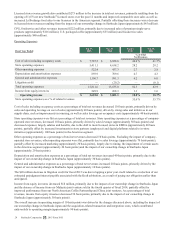
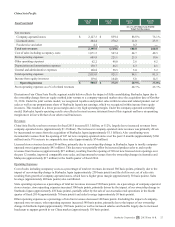
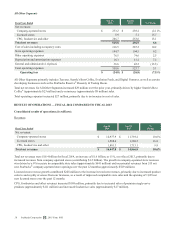
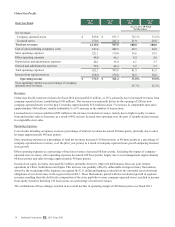
Operating Expenses
Fiscal Year Ended
Sep 27,
2015
Sep 28,
2014
Sep 27,
2015
Sep 28,
2014
% of Total
Net Revenues
Cost of sales including occupancy costs $ 7,787.5 $ 6,858.8 40.6 % 41.7 %
Store operating expenses 5,411.1 4,638.2 28.2 28.2
Other operating expenses 522.4 457.3 2.7 2.8
Depreciation and amortization expenses 893.9 709.6 4.7 4.3
General and administrative expenses 1,196.7 991.3 6.2 6.0
Litigation credit —(20.2) — (0.1)
Total operating expenses 15,811.6 13,635.0 82.5 82.9
Income from equity investees 249.9 268.3 1.3 1.6
Operating income $ 3,601.0 $ 3,081.1 18.8% 18.7%
Store operating expenses as a % of related revenues 35.6 % 35.7 %
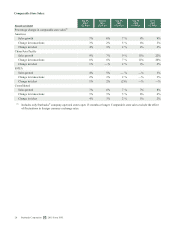
Cost of sales including occupancy costs as a percentage of total net revenues decreased 110 basis points, primarily driven by
sales and operating leverage on cost of sales (approximately 60 basis points), driven by strong sales and initiatives in our
supply chain, such as improvements in sourcing, as well as sales leverage on occupancy costs (approximately 40 basis points).
Store operating expenses were flat as a percentage of total net revenues. Store operating expenses as a percentage of company-
operated store revenues, decreased 10 basis points, primarily driven by sales leverage (approximately 50 basis points) and
decreased expenses, largely salaries and benefits, due to the shift to more licensed stores in EMEA (approximately 40 basis
points), partially offset by increased investments in store partners (employees) and digital platforms related to in-store
initiatives (approximately 100 basis points) in the Americas segment.
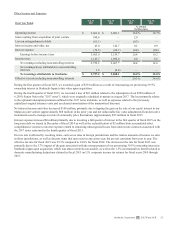
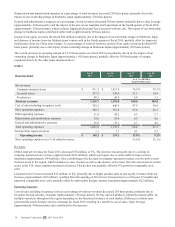
Other operating expenses as a percentage of total net revenues decreased 10 basis points. Excluding the impact of company-
operated store revenues, other operating expenses were flat, primarily due to sales leverage (approximately 70 basis points),
partially offset by increased marketing (approximately 20 basis points), largely due to timing, the impairment of certain assets
in the Americas segment (approximately 20 basis points) and the impact of our ownership change in Starbucks Japan
(approximately 20 basis points).
Depreciation and amortization expenses as a percentage of total net revenues increased 40 basis points, primarily due to the
impact of our ownership change in Starbucks Japan (approximately 30 basis points).
General and administrative expenses as a percentage of total net revenues increased 20 basis points, primarily driven by the
impact of our ownership change in Starbucks Japan (approximately 10 basis points).
The $20 million decrease in litigation credit for fiscal 2015 was due to lapping a prior year credit related to a reduction of our
estimated prejudgment interest payable associated with the Kraft arbitration, as a result of paying our obligation earlier than
anticipated.
Income from equity investees decreased $18 million, primarily due to the impact of our ownership change in Starbucks Japan
and the absence of income from our Malaysia joint venture sold in the fourth quarter of fiscal 2014, partially offset by
improved performance from our North American Coffee Partnership and China joint ventures. As a percentage of total
revenues, income from equity investees decreased 30 basis points, primarily due to the impact of our ownership change in
Starbucks Japan (approximately 30 basis points).
The overall increase in operating margin of 10 basis points was driven by the changes discussed above, including the impact of
our ownership change in Starbucks Japan and the acquisition-related transaction and integration costs, which contributed
unfavorably to operating margin (approximately 90 basis points).
24 Starbucks Corporation 2015 Form 10-K