Starbucks 2015 Annual Report Download - page 34
Download and view the complete annual report
Please find page 34 of the 2015 Starbucks annual report below. You can navigate through the pages in the report by either clicking on the pages listed below, or by using the keyword search tool below to find specific information within the annual report.-
 1
1 -
2
-
3
-
4
-
5
-
6
-
7
-
8
-
9
-
10
-
11
-
12
-
13
-
14
-
15
-
16
-
17
-
18
-
19
-
20
-
21
-
22
-
23
-
 24
24 -
 25
25 -
 26
26 -
 27
27 -
 28
28 -
 29
29 -
 30
30 -
 31
31 -
 32
32 -
 33
33 -
 34
34 -
 35
35 -
 36
36 -
 37
37 -
 38
38 -
 39
39 -
 40
40 -
 41
41 -
 42
42 -
 43
43 -
 44
44 -
45
-
46
-
47
-
48
-
49
-
50
-
51
-
52
-
53
-
54
-
55
-
56
-
57
-
58
-
59
-
60
-
61
-
62
-
63
-
64
-
65
-
66
-
67
-
68
-
69
-
70
-
71
-
72
-
73
-
74
-
75
-
76
-
77
-
78
-
79
-
80
-
81
-
82
-
83
-
84
-
85
-
86
-
87
-
88
-
89
-
90
-
91
-
92
-
93
-
94
-
95
-
96
-
97
-
98
-
99
-
100
-
101
-
102
-
103
-
104
-
105
-
106
-
107
-
108
 |
 |

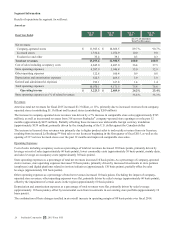
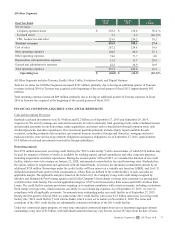
All Other Segments
Fiscal Year Ended
Sep 27,
2015
Sep 28,
2014 % Change
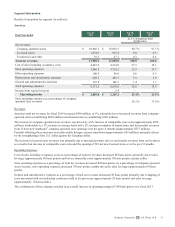
Net revenues:
Company-operated stores $ 233.2 $ 238.2 (2.1 )%
Licensed stores 5.9 5.1 15.7
CPG, foodservice and other 286.7 253.6 13.1
Total net revenues 525.8 496.9 5.8
Cost of sales including occupancy costs 316.5 287.2 10.2
Store operating expenses 104.7 104.5 0.2
Other operating expenses 76.5 74.6 2.5
Depreciation and amortization expenses 16.3 15.2 7.2
General and administrative expenses 36.6 42.2 (13.3)
Total operating expenses 550.6 523.7 5.1
Operating loss $(24.8) $ (26.8)(7.5)%
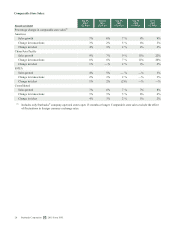
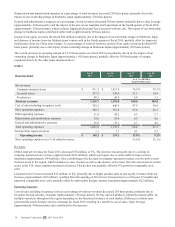
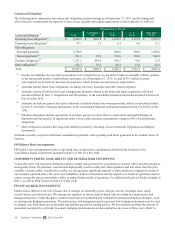
All Other Segments primarily includes Teavana, Seattle’s Best Coffee, Evolution Fresh, and Digital Ventures, as well as certain
developing businesses such as the Starbucks Reserve® Roastery & Tasting Room.
Total net revenues for All Other Segments increased $29 million over the prior year, primarily driven by higher Seattle's Best
Coffee® (approximately $23 million) and e-commerce (approximately $8 million) sales.
Total operating expenses increased $27 million, primarily due to an increase in cost of sales.
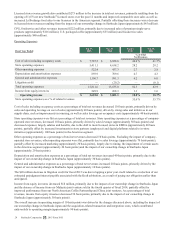
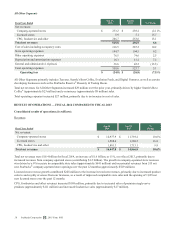
RESULTS OF OPERATIONS — FISCAL 2014 COMPARED TO FISCAL 2013
Consolidated results of operations (in millions):
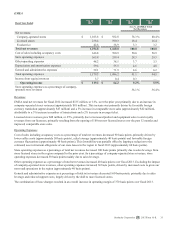
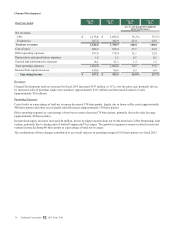
Revenues
Fiscal Year Ended
Sep 28,
2014
Sep 29,
2013
%
Change
Net revenues:
Company-operated stores $ 12,977.9 $ 11,793.2 10.0 %
Licensed stores 1,588.6 1,360.5 16.8
CPG, foodservice and other 1,881.3 1,713.1 9.8
Total net revenues $ 16,447.8 $ 14,866.8 10.6%
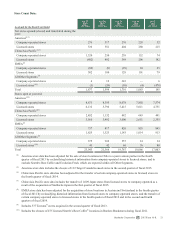
Total net revenues were $16.4 billion for fiscal 2014, an increase of $1.6 billion, or 11%, over fiscal 2013, primarily due to
increased revenues from company-operated stores (contributing $1.2 billion). The growth in company-operated store revenues
was driven by a 6% increase in comparable store sales (approximately $641 million) and incremental revenues from 555 net
new Starbucks® company-operated store openings over the past 12 months (approximately $529 million).
Licensed store revenue growth contributed $228 million to the increase in total net revenues, primarily due to increased product
sales to and royalty revenues from our licensees, as a result of improved comparable store sales and the opening of 1,029 net
new licensed stores over the past 12 months.
CPG, foodservice and other revenues increased $168 million, primarily due to increased sales of premium single-serve
products (approximately $111 million) and increased foodservice sales (approximately $17 million).
30 Starbucks Corporation 2015 Form 10-K