Target 2004 Annual Report Download - page 18
Download and view the complete annual report
Please find page 18 of the 2004 Target annual report below. You can navigate through the pages in the report by either clicking on the pages listed below, or by using the keyword search tool below to find specific information within the annual report.-
 1
1 -
2
-
3
-
4
-
5
-
6
-
7
-
 8
8 -
 9
9 -
 10
10 -
 11
11 -
 12
12 -
 13
13 -
 14
14 -
 15
15 -
 16
16 -
 17
17 -
 18
18 -
 19
19 -
 20
20 -
 21
21 -
 22
22 -
 23
23 -
 24
24 -
 25
25 -
 26
26 -
 27
27 -
 28
28 -
29
-
30
-
31
-
32
-
33
-
34
-
35
-
36
-
37
-
38
-
39
-
40
-
41
-
42
-
43
-
44
 |
 |

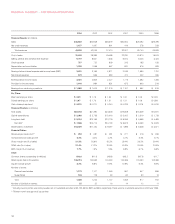
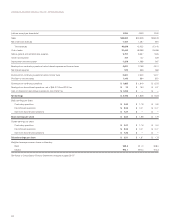
16
2004 2003 2002 2001 2000 1999
Financial Results: (in millions)
Sales $45,682 $40,928 $36,519 $32,602 $29,462 $26,296
Net credit revenues 1,157 1,097 891 419 278 233
Total revenues 46,839 42,025 37,410 33,021 29,740 26,529
Cost of sales 31,445 28,389 25,498 23,030 20,870 18,576
Selling, general and administrative expense 9,797 8,657 7,505 6,612 6,025 5,424
Credit expense 737 722 629 313 185 155
Depreciation and amortization 1,259 1,098 967 820 676 583
Earnings before interest expense and income taxes (EBIT) 3,601 3,159 2,811 2,246 1,984 1,791
Net interest expense 570 556 584 470 422 455
Earnings before income taxes 3,031 2,603 2,227 1,776 1,562 1,336
Provision for income taxes 1,146 984 851 675 600 518
Earnings from continuing operations $ 1,885 $ 1,619 $ 1,376 $ 1,101 $ 962 $ 818
Per Share:
Basic earnings per share $2.09 $ 1.78 $ 1.52 $ 1.22 $ 1.06 $ 0.93
Diluted earnings per share $2.07 $ 1.76 $ 1.51 $ 1.21 $ 1.06 $ 0.88
Cash dividends declared $0.310 $ 0.270 $ 0.240 $ 0.225 $ 0.215 $ 0.200
Financial Position: (in millions)
Total assets $32,293 $27,390 $24,506 $19,808 $15,349 $12,970
Capital expenditures $ 3,068 $ 2,738 $ 3,040 $ 3,002 $ 2,319 $ 1,733
Long-term debt $9,034 $10,155 $10,119 $ 8,055 $ 5,598 $ 4,483
Net debt*$ 7,806 $10,774 $10,733 $ 8,873 $ 6,453 $ 4,979
Shareholders’ investment $13,029 $11,132 $ 9,497 $ 7,896 $ 6,548 $ 5,871
Financial Ratios:
Revenues per square foot** $ 294 $ 287 $ 281 $ 277 $ 276 $ 269
Comparable store sales growth 5.3% 4.4% 2.2% 4.1% 3.4% 6.7%
Gross margin rate (% of sales) 31.2% 30.6% 30.2% 29.4% 29.2% 29.4%
SG&A rate (% of sales) 21.4% 21.2% 20.5% 20.3% 20.5% 20.6%
EBIT margin (% of revenue) 7.7% 7.5% 7.5% 6.8% 6.7% 6.8%
Other:
Common shares outstanding (in millions) 890.6 911.8 909.8 905.2 897.8 911.7
Retail square feet (in thousands) 165,015 152,563 140,294 125,359 113,060 103,369
Square footage growth 8.2% 8.8% 11.9% 10.9% 9.4% 8.9%
Number of stores
General merchandise 1,172 1,107 1,053 991 947 896
SuperTarget 136 118 94 62 30 16
Tot al 1,308 1,225 1,147 1,053 977 912
Number of distribution centers 25 22 16 14 12 11
** Including current portion and notes payable, net of marketable securities of $1,732, $244, $357 and $84, respectively. There were no marketable securities in 2000 and 1999.
** Thirteen-month average retail square feet.
FINANCIAL SUMMARY – CONTINUING OPERATIONS