Target 2004 Annual Report Download - page 32
Download and view the complete annual report
Please find page 32 of the 2004 Target annual report below. You can navigate through the pages in the report by either clicking on the pages listed below, or by using the keyword search tool below to find specific information within the annual report.-
 1
1 -
2
-
3
-
4
-
5
-
6
-
7
-
8
-
9
-
10
-
11
-
12
-
13
-
14
-
15
-
16
-
17
-
18
-
19
-
20
-
21
-
 22
22 -
 23
23 -
 24
24 -
 25
25 -
 26
26 -
 27
27 -
 28
28 -
 29
29 -
 30
30 -
 31
31 -
 32
32 -
 33
33 -
 34
34 -
 35
35 -
 36
36 -
 37
37 -
 38
38 -
 39
39 -
 40
40 -
 41
41 -
 42
42 -
43
-
44
 |
 |

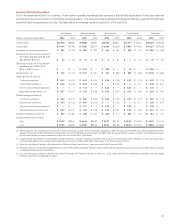
30
Cash Equivalents
Cash equivalents represent short-term investments with a maturity
of three months or less from the time of purchase and were $1,732
million, $244 million and $357 million in 2004, 2003 and 2002, respec-
tively. The increase of $1,488 in 2004 compared to 2003 is primarily
due to investment of the remaining proceeds at year end from the
divestitures of Marshall Field’s and Mervyn’s.
Accounts Receivable
Accounts receivable are recorded net of an allowance for expected
losses. The allowance, recognized in an amount equal to the antici-
pated future write-offs based on delinquencies, risk scores, aging
trends, industry risk trends and our historical experience, was $387
million at January 29, 2005 and $352 million at January 31, 2004.
Through our special purpose subsidiary, Target Receivables
Corporation (TRC), we transfer, on an ongoing basis, substantially all
of our receivables to the Target Credit Card Master Trust (the Trust)
in return for certificates representing undivided interests in the Trust’s
assets. TRC owns the undivided interest in the Trust’s assets, other
than the Trust’s assets securing the financing transactions entered into
by the Trust and the 2 percent of Trust assets held by Target National
Bank (TNB). TNB is a wholly owned subsidiary of the Corporation
that also services receivables. SFAS No.140 “Accounting for Transfers
and Servicing of Financial Assets and Extinguishments of Liabilities
(a replacement of SFAS No. 125)” is the accounting guidance appli-
cable to such transactions. SFAS No. 140 requires that we include the
receivables within the Trust and any debt securities issued by the Trust
in our Consolidated Statement of Financial Position. Notwithstanding
this accounting treatment, the receivables within the Trust are owned
by our wholly-owned, bankruptcy remote subsidiary, TRC, and thus
are not available to general creditors of Target.
Inventory
Substantially all of our inventory and the related cost of sales are
accounted for under the retail inventory accounting method using the
last-in, first-out (LIFO) basis. Inventory is stated at the lower of LIFO
cost or market. Inventory also includes a LIFO provision that is calcu-
lated based on inventory levels, markup rates and internally generated
retail price indices. Our only accumulated LIFO reserve relates to
Target Commercial Interiors and is immaterial to our consolidated
financial statements. Because we have experienced price deflation
recently, we have not recorded a LIFO provision for Target Stores.
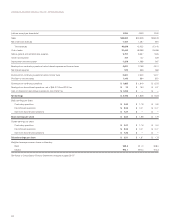
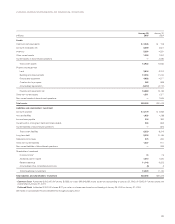
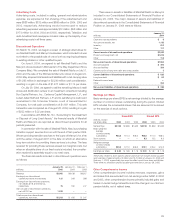
Other Current Assets
Other current assets as of January 29, 2005 and January 31, 2004
consist of the following:
2004 2003
Vendor income and other receivables $ 428 $ 391
Deferred taxes 344 236
Other 452 373
Tot al $1,224 $1,000
In addition to vendor income, other receivables relate primarily to pharmacy receivables
and merchandise sourcing services provided to third parties.
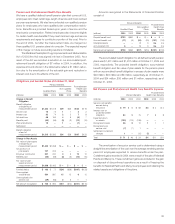
Property and Equipment
Property and equipment are recorded at cost, less accumulated
depreciation. Depreciation is computed using the straight-line method
over estimated useful lives. Depreciation expense for the years 2004,
2003 and 2002 was $1,232 million, $1,068 million and $942 million,
respectively. Accelerated depreciation methods are generally used
for income tax purposes. Repair and maintenance costs were $453
million, $393 million and $355 million in 2004, 2003 and 2002,
respectively.
Estimated useful lives by major asset category are as follows:
Asset Life (in years)
Buildings and improvements 8–39
Fixtures and equipment 4 –15
Computer hardware and software 4
In accordance with SFAS No.144, “Accounting for the Impairment
or Disposal of Long-Lived Assets,” all long-lived assets are reviewed
when events or changes in circumstances indicate that the carrying
value of the asset may not be recoverable. We review assets at the
lowest level for which there are identifiable cash flows, which is usually
at the store level. The carrying amount of the store assets is compared
to the expected undiscounted future cash flows to be generated by
those assets over the estimated remaining useful life of the store.
Cash flows are projected for each store based upon historical results
and expectations. In cases where the expected future cash flows and
fair value are less than the carrying amount of the assets, those stores
are considered impaired and the assets are written down to fair value.
Fair value is based on appraisals or other reasonable methods to
estimate fair value. Impairment losses are included in depreciation
expense for assets held and in use and included within selling, general
and administrative expense on assets classified as held for sale.
No impairments were recorded in 2004 or 2003 as a result of the
tests performed.
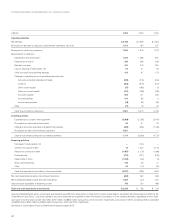
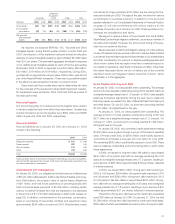
Other Non-current Assets
Other non-current assets as of January 29, 2005 and January 31,
2004 consist of the following:
2004 2003
Prepaid pension expense $ 711 $ 580
Cash value of life insurance 439 363
Goodwill and intangible assets 206 229
Other 155 205
Tot al $1,511 $1,377
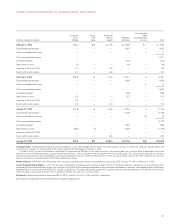
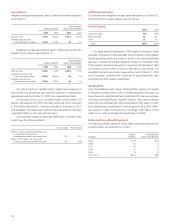
Goodwill and Intangible Assets
Goodwill and intangible assets are recorded within other non-current
assets at cost less accumulated amortization. Amortization is
computed on intangible assets with definite useful lives using the
straight-line method over estimated useful lives that range from
three to fifteen years. Amortization expense for the years 2004, 2003
and 2002 was $27 million, $30 million and $25 million, respectively.
At January 29, 2005 and January 31, 2004, goodwill and intangible
assets by major classes were as follows: