Target 2004 Annual Report Download - page 22
Download and view the complete annual report
Please find page 22 of the 2004 Target annual report below. You can navigate through the pages in the report by either clicking on the pages listed below, or by using the keyword search tool below to find specific information within the annual report.-
 1
1 -
2
-
3
-
4
-
5
-
6
-
7
-
8
-
9
-
10
-
11
-
 12
12 -
 13
13 -
 14
14 -
 15
15 -
 16
16 -
 17
17 -
 18
18 -
 19
19 -
 20
20 -
 21
21 -
 22
22 -
 23
23 -
 24
24 -
 25
25 -
 26
26 -
 27
27 -
 28
28 -
 29
29 -
 30
30 -
 31
31 -
 32
32 -
33
-
34
-
35
-
36
-
37
-
38
-
39
-
40
-
41
-
42
-
43
-
44
 |
 |
20
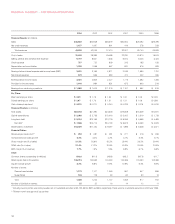
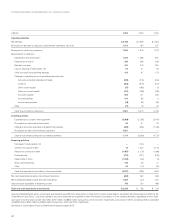
Interest coverage ratio represents the ratio of pre-tax earnings
before fixed charges (interest expense and the interest portion of
rent expense) to fixed charges. Our interest coverage ratio calculated
under generally accepted accounting principles was 5.4x, 5.1x and
4.3x in 2004, 2003 and 2002, respectively. These ratios are adversely
affected by the losses from discretionary debt repurchase transactions
and they exclude the historical income from discontinued operations.
Management believes that adjustments for these two issues are
necessary to make the coverage ratio a more useful and consistent
indicator of creditworthiness.
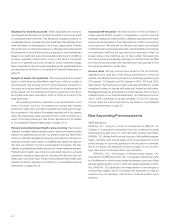
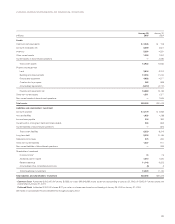
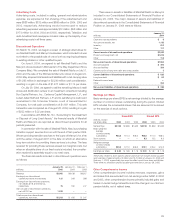
Capital Expenditures
Capital expenditures were $3,068 million
in 2004, compared with $2,738 million
in 2003 and $3,040 million in 2002. Our
higher spending level in 2004 is pri-
marily due to the increase in new store
expansion, our remodel program and
more land purchases in lieu of leases.
Net property and equipment increased
$1,707 million in 2004, compared with
an increase of $1,612 million in 2003.
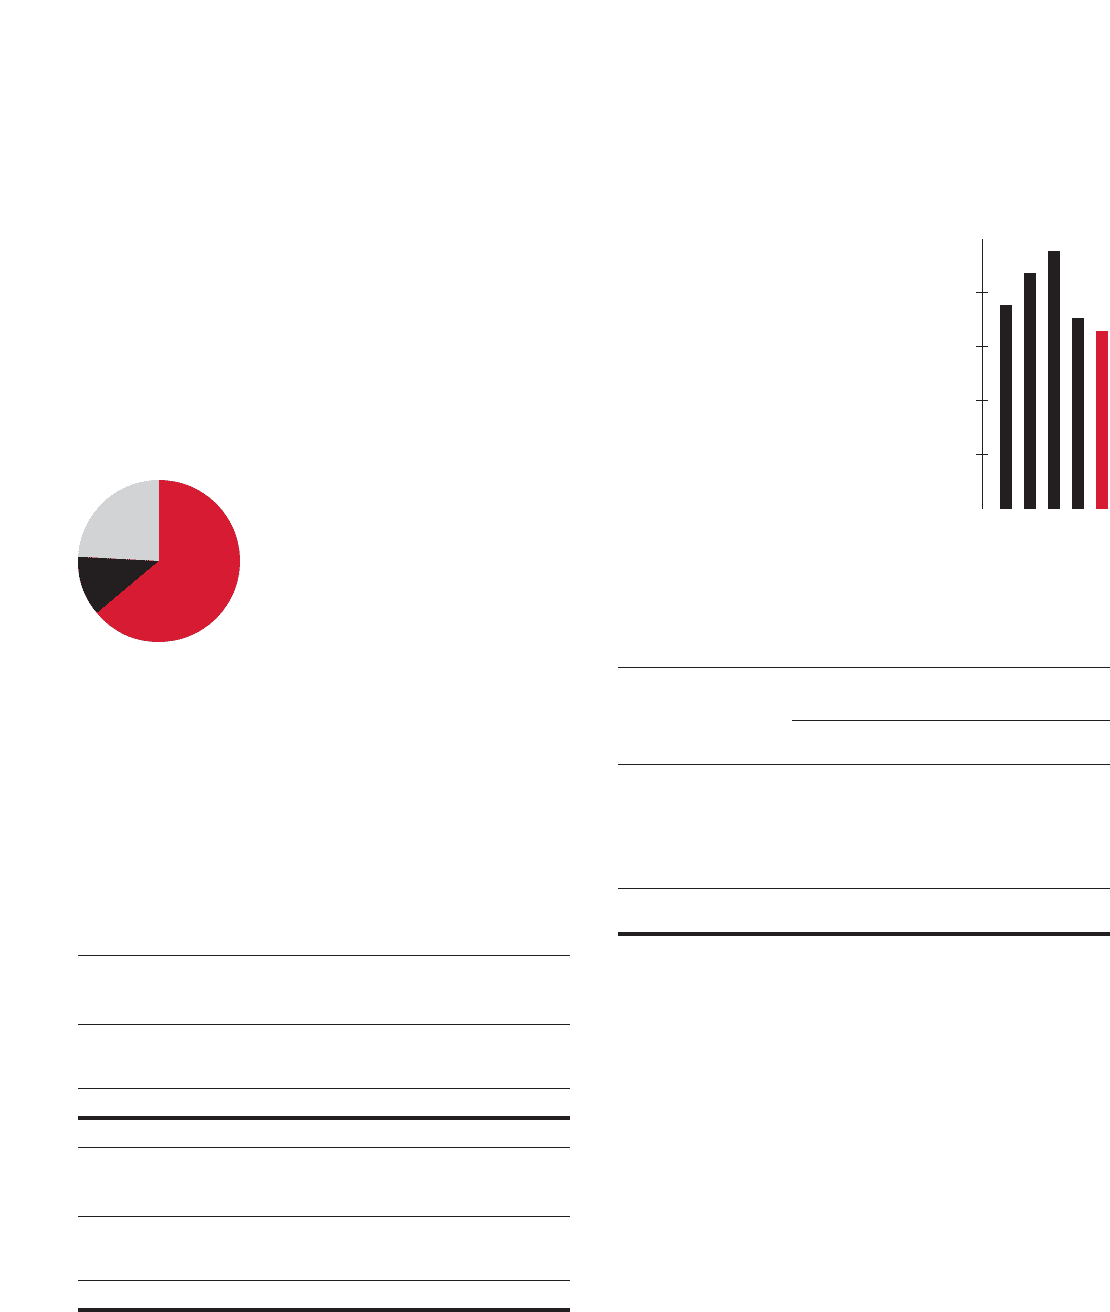
Over the past five years, Target’s net
retail square footage has grown at a
compound annual rate of 9.8 percent.
Approximately 76 percent and 78 percent of total capital
expenditures in 2004 and 2003, respectively, were for new stores,
expansions and remodels. Other capital investments were for
information system hardware and software, distribution capacity and
other infrastructure to support store growth.
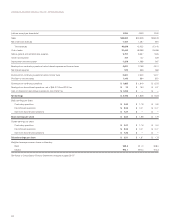
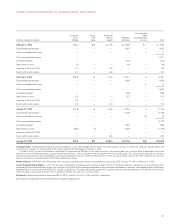
Number of Stores
January 29, January 31,
2005 Opened Closed*2004
Target General
Merchandise Stores 1,172 80 15 1,107
SuperTarget Stores 136 18 — 118
Tot al 1,308 98 15 1,225
Retail Square Feet
January 29, January 31,
(thousands) 2005 Opened Closed*2004
Target General
Merchandise Stores 140,953 10,950 1,635 131,638
SuperTarget Stores 24,062 3,137 — 20,925
Tot al 165,015 14,087 1,635 152,563
* Typically relates to stores that have been relocated to a new store in the same
trade area.
At year-end 2004, we owned 1,071 stores, leased 86 stores and operated 151
“combined” stores for a total of 1,308 locations. Stores within the “combined”
category are primarily owned buildings on leased land.
In 2005, we expect to invest
$3,200 million to $3,400 million, mostly
in new store square footage, as well
as the distribution infrastructure and
systems to support this growth. Our
estimated 2005 store opening program
reflects net square footage growth of
approximately 8 percent, reflecting 105
to 110 new stores partially offset by
closings and relocations. In addition,
we expect to substantially remodel
approximately 75 stores, some of which
will also be expanded.
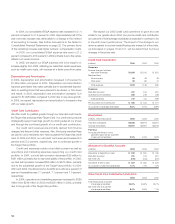
Commitments and Contingencies
At January 29, 2005, our debt, lease
and royalty contractual obligations were
as follows:
Contractual Obligations
Payments Due by Period
Less than 1–3 3–5 After 5
(millions) Total 1 Year Years Years Years
Long-term debt*$ 9,402 $ 501 $2,072 $2,202 $4,627
Interest payments** 4,580 532 943 711 2,394
Capital lease
obligations 189 12 25 25 127
Operating leases*** 3,049 146 279 219 2,405
Merchandise royalties 102 49 49 4 —
Contractual cash
obligations $17,322 $1,240 $3,368 $3,161 $9,553
*** Required principal payments only. Excludes SFAS No. 133, “Accounting for
Derivative Instruments and Hedging Activities,” fair market value adjustments
recorded in long-term debt.
*** Includes payments on $750 million of floating-rate long-term debt secured by
credit card receivables which matures in 2007. These payments are calculated
assuming rates of 3.25 percent, 3.75 percent and 4.25 percent, for 2005, 2006,
and 2007, respectively. Excludes payments received or made relating to interest
rate swaps discussed on page 32.
*** Total contractual lease payments include certain options to extend the lease term,
in the amount of $1,415 million, that are expected to be exercised because the
investment in leasehold improvements is significant.
Commitments for the purchase, construction, lease or remodeling
of real estate, facilities and equipment were approximately $544 million
at year-end 2004.
Throughout the year, we enter into various commitments to pur-
chase inventory. In addition to the accounts payable reflected in our
Consolidated Statements of Financial Position on page 25, we had
commitments with various vendors for the purchase of inventory as of
January 29, 2005. The previous table excludes these commitments
because they are cancelable by their terms.
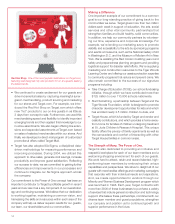
Capital
Expenditures
• New Stores
• Remodels and Expansions
• Information Technology,
• Distribution and Other
64%
12%
24% ’00’01’02’03’04
9.4%
10.9%
11.9%
8.8%
8.2%
10.0
7.5
5.0
2.5
Annual Growth
in Net Retail
Square Footage
(millions)