Target 2004 Annual Report Download - page 35
Download and view the complete annual report
Please find page 35 of the 2004 Target annual report below. You can navigate through the pages in the report by either clicking on the pages listed below, or by using the keyword search tool below to find specific information within the annual report.-
 1
1 -
2
-
3
-
4
-
5
-
6
-
7
-
8
-
9
-
10
-
11
-
12
-
13
-
14
-
15
-
16
-
17
-
18
-
19
-
20
-
21
-
22
-
23
-
24
-
 25
25 -
 26
26 -
 27
27 -
 28
28 -
 29
29 -
 30
30 -
 31
31 -
 32
32 -
 33
33 -
 34
34 -
 35
35 -
 36
36 -
 37
37 -
 38
38 -
 39
39 -
 40
40 -
 41
41 -
 42
42 -
 43
43 -
 44
44
 |
 |

33
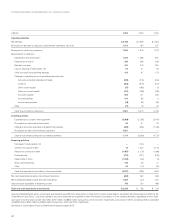
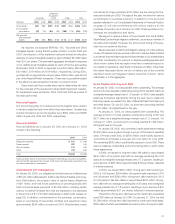
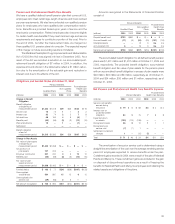
Income Taxes
Reconciliation of tax rates is as follows:
Tax Rate Reconciliation
2004 2003 2002
Federal statutory rate 35.0% 35.0% 35.0%
State income taxes,
net of federal tax benefit 3.3 3.3 3.4
Dividends on ESOP stock (0.2) (0.2) (0.2)
Work opportunity tax credits (0.2) (0.2) (0.2)
Other (0.1) (0.1) 0.2
Effective tax rate 37.8% 37.8% 38.2%
The components of the provision for income taxes were:
Income Tax Provision: Expense
(millions) 2004 2003 2002
Current:
Federal $ 908 $ 669 $ 550
State 144 107 93
1,052 776 643
Deferred:
Federal 83 184 185
State 11 24 23
94 208 208
Tot al $1,146 $ 984 $ 851
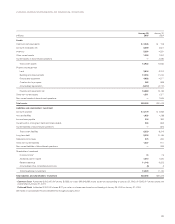
The components of the net deferred tax asset/(liability) were:
Net Deferred Tax Asset/(Liability)
January 29, January 31,
(millions) 2005 2004
Gross deferred tax assets:
Deferred compensation $332 $ 297
Self-insured benefits 179 143
Accounts receivable valuation allowance 147 133
Inventory 47 44
Postretirement health care obligation 38 42
Other 128 53
871 712
Gross deferred tax liabilities:
Property and equipment (1,136) (806)
Pension (268) (218)
Other (96) (84)
(1,500) (1,108)
Tot al $ (629) $ (396)
In the Consolidated Statement of Financial Position, the current
deferred tax asset balance is the net of all current deferred tax assets
and current deferred tax liabilities. The non-current deferred tax liability
is the net of all non-current deferred tax assets and non-current
deferred tax liabilities.
Approximately $566 million of the proceeds attributable to the
real properties sold in the Marshall Field’s and Mervyn’s dispositions
were used to acquire replacement properties which will be used in
our business. Approximately $371 million of the gain related to the
sold real properties was deferred for income tax purposes as required
by Section 1031 of the Internal Revenue Code until such time as the
replacement properties are disposed.
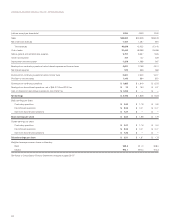
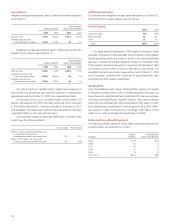
Other Non-current Liabilities
Other non-current liabilities as of January 29, 2005 and January 31,
2004 consist of the following:
2004 2003
Deferred compensation $ 528 $464
Worker’s compensation and general liability 317 286
Other 192 167
Tot al $1,037 $917
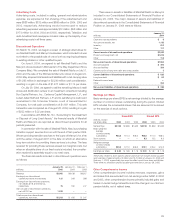
Share Repurchase
In June 2004, our Board of Directors authorized the repurchase of
$3 billion of our common stock, which we expect to complete over
two to three years. This authorization replaced our previous repur-
chase programs that were authorized by our Board of Directors in
January 1999 and March 2000. We repurchased 29 million shares
at an average price per share of $44.68 during 2004, at a total cost
of $1,290 million.
Stock-based Compensation
We maintain a long-term incentive plan for key employees and non-
employee members of our Board of Directors. Our long-term incentive
plan allows for the grant of equity-based compensation awards,
including stock options, performance share awards, restricted stock
awards, or a combination of awards. A majority of the awards are
non-qualified stock options that vest annually in equal amounts over
a four-year period. Therefore, in accordance with SFAS No.123R, we
recognize compensation expense for these awards on a straight-line
basis over the four-year vesting period. These options generally expire
no later than ten years after the date of the grant. Options granted
to the non-employee members of our Board of Directors vest after
one year and have a ten-year term. Performance share awards repre-
sent shares issuable in the future based upon attainment of specified
levels of future financial performance. We use a three or four year
performance measurement period for performance share awards.
The number of unissued common shares reserved for future grants
under the stock-based compensation plans was 51,560,249 at
January 29, 2005 and 19,279,658 at January 31, 2004.