Target 2004 Annual Report Download - page 31
Download and view the complete annual report
Please find page 31 of the 2004 Target annual report below. You can navigate through the pages in the report by either clicking on the pages listed below, or by using the keyword search tool below to find specific information within the annual report.-
 1
1 -
2
-
3
-
4
-
5
-
6
-
7
-
8
-
9
-
10
-
11
-
12
-
13
-
14
-
15
-
16
-
17
-
18
-
19
-
20
-
 21
21 -
 22
22 -
 23
23 -
 24
24 -
 25
25 -
 26
26 -
 27
27 -
 28
28 -
 29
29 -
 30
30 -
 31
31 -
 32
32 -
 33
33 -
 34
34 -
 35
35 -
 36
36 -
 37
37 -
 38
38 -
 39
39 -
 40
40 -
 41
41 -
42
-
43
-
44
 |
 |

29
Advertising Costs
Advertising costs, included in selling, general and administrative
expense, are expensed at first showing of the advertisement and
were $888 million, $872 million and $666 million for 2004, 2003 and
2002, respectively. Advertising vendor income used to reduce
advertising expenses was approximately $72 million, $58 million and
$173 million for 2004, 2003 and 2002, respectively. Television and
radio broadcast and newspaper circulars make up the majority of our
advertising costs in all three years.
Discontinued Operations
On March 10, 2004, we began a review of strategic alternatives for
our Marshall Field’s and Mervyn’s businesses, which included but was
not limited to the possible sale of one or both as ongoing businesses
to existing retailers or other qualified buyers.
On June 9, 2004, we agreed to sell Marshall Field’s and the
Mervyn’s stores located in Minnesota to The May Department Store
Company (May). We completed the sale of Marshall Field’s on July 31,
2004 and the sale of the Minnesota Mervyn’s stores on August 24,
2004. May acquired total assets and liabilities with a net carrying value
of $1,563 million in exchange for $3,240 million cash consideration,
resulting in a gain on the sale of $1,677 million or $1.14 per share.
On July 29, 2004, we agreed to sell the remaining Mervyn’s retail
stores and distribution centers to an investment consortium including
Sun Capital Partners, Inc., Cerberus Capital Management, L.P., and
Lubert-Adler/Klaff and Partners, L.P. and to sell Mervyn’s credit card
receivables to GE Consumer Finance, a unit of General Electric
Company, for total cash consideration of $1,641 million. This sale
transaction was completed as of August 28, 2004, resulting in a gain
of $322 million or $.22 per share.
In accordance with SFAS No.144, “Accounting for the Impairment
or Disposal of Long-Lived Assets,” the financial results of Marshall
Field’s and Mervyn’s are reported as discontinued operations for all
periods presented.
In connection with the sale of Marshall Field’s, May is purchasing
transition support services from us until the end of first quarter 2005.
We are providing transition services to the buyer of Mervyn’s for a fee
until the earlier of August 2007 or the date on which an alternative
long-term solution for providing these services is in place. The fees
received for providing these services exceed our marginal costs, but
when an allocable share of our fixed costs is included, the consider-
ation received is essentially equal to our total costs.
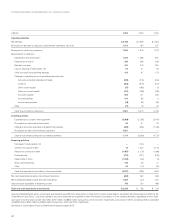
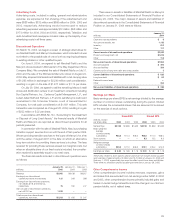
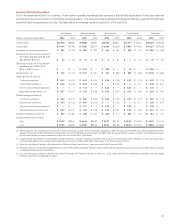
The financial results included in discontinued operations were
as follows:
January 29, January 31, February 1,
(millions) 2005 2004 2003
Revenue $3,095 $6,138 $6,507
Earnings from discontinued
operations before income taxes 121 306 399
Earnings from discontinued operations,
net of $46, $116 and $152 tax,
respectively 75 190 247
Gain on sale of discontinued operations,
net of $761 tax 1,238 ——
Total income from discontinued
operations, net of tax $1,313 $ 190 $ 247
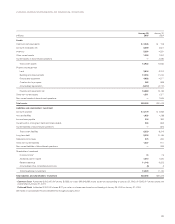
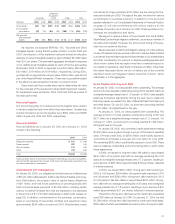
There were no assets or liabilities of Marshall Field’s or Mervyn’s
included in our Consolidated Statements of Financial Position at
January 29, 2005. The major classes of assets and liabilities of
discontinued operations in the Consolidated Statements of Financial
Position on January 31, 2004 were as follows:
January 31,
(millions) 2004
Cash and cash equivalents $8
Accounts receivable, net 1,155
Inventory 812
Other 117
Current assets of discontinued operations $2,092
Property and equipment, net $1,816
Other 118
Non-current assets of discontinued operations $1,934
Accounts payable $ 492
Accrued liabilities 330
Current portion of long-term debt and notes payable 3
Current liabilities of discontinued operations $ 825
Long-term debt $62
Deferred income taxes —
Other 204
Non-current liabilities of discontinued operations $ 266
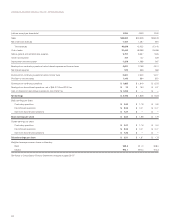
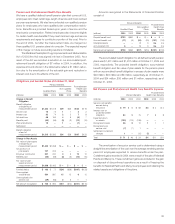
Earnings per Share
Basic earnings per share (EPS) is net earnings divided by the average
number of common shares outstanding during the period. Diluted
EPS includes the incremental shares that are assumed to be issued
on the exercise of stock options.
Basic EPS Diluted EPS
(millions, except
per share data) 2004 2003 2002 2004 2003 2002
Net earnings $3,198 $1,809 $1,623 $3,198 $1,809 $1,623
Basic weighted
average
common shares
outstanding 903.8 911.0 908.0 903.8 911.0 908.0
Stock options ———8.3 8.2 6.3
Weighted average
common shares
outstanding 903.8 911.0 908.0 912.1 919.2 914.3
Earnings per share $ 3.54 $ 1.99 $ 1.79 $3.51 $ 1.97 $ 1.78
The shares related to stock options shown above do not include shares issuable
upon exercise of approximately 4.5 million and 13.2 million at January 31, 2004 and
February 1, 2003, respectively, because the effect would have been antidilutive.
There were no antidilutive shares issuable upon exercise at January 29, 2005.
Other Comprehensive Income
Other comprehensive income includes revenues, expenses, gains
and losses that are excluded from net earnings under GAAP. In 2004
and 2003, other comprehensive income primarily included gains and
losses on certain hedge transactions and the change in our minimum
pension liability, net of related taxes.