Target 2004 Annual Report Download - page 28
Download and view the complete annual report
Please find page 28 of the 2004 Target annual report below. You can navigate through the pages in the report by either clicking on the pages listed below, or by using the keyword search tool below to find specific information within the annual report.-
 1
1 -
2
-
3
-
4
-
5
-
6
-
7
-
8
-
9
-
10
-
11
-
12
-
13
-
14
-
15
-
16
-
17
-
 18
18 -
 19
19 -
 20
20 -
 21
21 -
 22
22 -
 23
23 -
 24
24 -
 25
25 -
 26
26 -
 27
27 -
 28
28 -
 29
29 -
 30
30 -
 31
31 -
 32
32 -
 33
33 -
 34
34 -
 35
35 -
 36
36 -
 37
37 -
 38
38 -
39
-
40
-
41
-
42
-
43
-
44
 |
 |

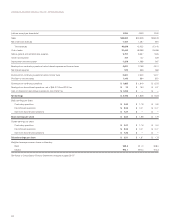
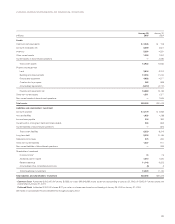
26
(millions) 2004 2003 2002
Operating activities
Net earnings $ 3,198 $ 1,809 $ 1,623
Earnings from and gain on disposal of discontinued operations, net of tax 1,313 190 247
Earnings from continuing operations 1,885 1,619 1,376
Reconciliation to cash flow:
Depreciation and amortization 1,259 1,098 967
Deferred tax provision 233 208 208
Bad debt provision 451 476 391
Loss on disposal of fixed assets, net 59 41 54
Other non-cash items affecting earnings 133 67 179
Changes in operating accounts providing/(requiring) cash:
Accounts receivable originated at Target (209) (279) (454)
Inventory (853) (579) (370)
Other current assets (37) (196) 13
Other non-current assets (147) (166) (136)
Accounts payable 823 721 545
Accrued liabilities 319 85 3
Income taxes payable (78) 99 (80)
Other (17) 19 29
Cash flow provided by operations 3,821 3,213 2,725
Investing activities
Expenditures for property and equipment (3,068) (2,738) (3,040)
Proceeds from disposals of fixed assets 56 67 32
Change in accounts receivable originated at third parties (690) (538) (1,768)
Proceeds from sale of discontinued operations 4,881 ——
Cash flow provided by/(required for) investing activities 1,179 (3,209) (4,776)
Financing activities
Decrease in notes payable, net —(100) —
Additions to long-term debt 10 1,200 3,116
Reductions of long-term debt (1,487) (1,179) (1,098)
Dividends paid (272) (237) (218)
Repurchase of stock (1,290) (48) (3)
Stock option exercises 146 36 27
Other 56 (10) (20)
Cash flow (required for)/provided by financing activities (2,837) (338) 1,804
Net cash (required)/provided by discontinued operations (626) 292 508
Net increase/(decrease) in cash and cash equivalents 1,537 (42) 261
Cash and cash equivalents at beginning of year 708 750 489
Cash and cash equivalents at end of year $ 2,245 $ 708 $ 750
Amounts presented herein are on a cash basis and therefore may differ from those shown in other sections of this Annual Report. Consistent with the provisions of SFAS No.95,
“Statement of Cash Flows,” cash flows related to accounts receivable are classified as either Provided by Operations or From Investing Activities, depending on their origin.
Cash paid for income taxes was $1,742 million, $781 million and $853 million during 2004, 2003 and 2002, respectively. Cash paid for interest (including interest capitalized)
was $498 million, $550 million and $526 million during 2004, 2003 and 2002, respectively.
See Notes to Consolidated Financial Statements throughout pages 28-37.
CONSOLIDATED STATEMENTS OF CASH FLOWS