Target 2004 Annual Report Download - page 21
Download and view the complete annual report
Please find page 21 of the 2004 Target annual report below. You can navigate through the pages in the report by either clicking on the pages listed below, or by using the keyword search tool below to find specific information within the annual report.-
 1
1 -
2
-
3
-
4
-
5
-
6
-
7
-
8
-
9
-
10
-
 11
11 -
 12
12 -
 13
13 -
 14
14 -
 15
15 -
 16
16 -
 17
17 -
 18
18 -
 19
19 -
 20
20 -
 21
21 -
 22
22 -
 23
23 -
 24
24 -
 25
25 -
 26
26 -
 27
27 -
 28
28 -
 29
29 -
 30
30 -
 31
31 -
32
-
33
-
34
-
35
-
36
-
37
-
38
-
39
-
40
-
41
-
42
-
43
-
44
 |
 |
1919
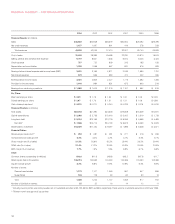
Net Interest Expense
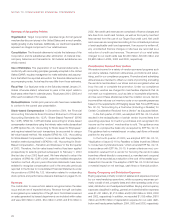
In 2004, net interest expense was $570 million, $14 million higher
than 2003. This increase was due to a $74 million higher loss on debt
called or repurchased and a higher average portfolio interest rate
resulting from the unfavorable mix effect of higher balances of short-
term investments and higher market rates. This increase was partially
offset by significantly lower average debt, net of investments, due to
cash received from the dispositions of Marshall Field’s and Mervyn’s.
The average portfolio interest rate was 5.5 percent in 2004 and 4.9
percent in 2003. The $542 million of debt called or repurchased during
2004 resulted in a loss of $89 million (approximately $.06 per share)
and had an average interest rate of 7.0 percent and an average
remaining life of 24 years.
In 2003, net interest expense was $556 million, $28 million lower
than 2002. The decrease was due to a lower average portfolio interest
rate and a smaller loss on debt called or repurchased, partially offset
by higher average debt outstanding. The average portfolio interest rate
in 2003 was 4.9 percent compared with 5.6 percent in 2002. The
$297 million of debt called or repurchased during 2003 resulted in a
loss of $15 million (approximately $.01 per share) and had an average
interest rate of 7.8 percent and an average remaining life of 20 years.
Excluding any effect of future debt repurchases, we expect net
interest expense in 2005 to be lower than 2004 due to lower loss on
debt repurchase and lower average net debt balances in the first half
of the year. Additionally, the majority of our credit card receivables will
be assessed finance charges at a prime-based floating rate instead
of a fixed rate in 2005. In order to protect our credit card economics in
light of future changes in the prime rate, we plan to maintain a sufficient
level of floating-rate debt to achieve parallel changes in our finance
charge revenue and interest expense.
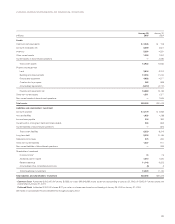
Analysis of Financial Condition
Liquidity and Capital Resources
Our financial condition remains strong.
In assessing our financial condition, we
consider factors such as cash flows
provided or used by operations, capital
expenditures and debt service obliga-
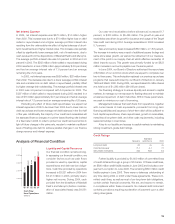
tions. Cash flow provided by operations
increased to $3,821 million in 2004 from
$3,213 million in 2003, primarily due to
higher net income. During 2004, cash
provided from the divestiture of Marshall
Field’s and Mervyn’s (before consider-
ation of associated taxes) was $4,881
million.
Our year-end receivables (before allowance) increased 9.7
percent, or $483 million, to $5,456 million. The growth in year-end
receivables was driven by growth in issuance and usage of the Target
Visa credit card during 2004. Average receivables in 2004 increased
5.7 percent.
Year-end inventory levels increased $853 million, or 18.8 percent.
The increase in inventory was a result of additional square footage and
same store sales growth, as well as the refinement of our measure-
ment of the point in our supply chain at which effective ownership of
direct imports occurs. This growth was primarily funded by an $823
million increase in accounts payable over the same period.
In June 2004, our Board of Directors authorized the repurchase
of $3 billion of our common stock which we expect to complete over
two to three years. This authorization replaced our previous repurchase
programs that were authorized by our Board of Directors in January
1999 and March 2000. During 2004, we repurchased 29 million shares
at a total cost of $1,290 million ($44.68 per share).
Our financing strategy is to ensure liquidity and access to capital
markets, to manage our net exposure to floating rates and to maintain
a balanced spectrum of debt maturities. Within these parameters,
we seek to minimize our cost of borrowing.
Management believes that cash flows from operations, together
with current levels of cash equivalents, proceeds from long-term
financing activities and issuance of short-term debt will be sufficient to
fund capital expenditures, share repurchases, growth in receivables,
maturities of long-term debt, and other cash requirements, including
seasonal buildup in inventories.
A key to our liquidity and access to capital markets is maintaining
strong investment-grade debt ratings.
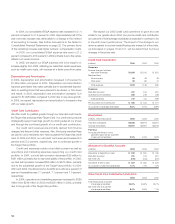
Credit Ratings
Standard
Moody’s and Poor’s Fitch
Long-term debt A2 A+ A+
Commercial paper P-1 A-1 F1
Securitized receivables Aaa AAA n/a
Further liquidity is provided by $1,600 million of committed lines
of credit obtained through a group of 25 banks. Of these credit lines,
an $800 million credit facility expires in June 2005 and includes a one-
year term-out option to June 2006. The remaining $800 million credit
facility expires in June 2008. There were no balances outstanding at
any time during 2004 or 2003 under these agreements. These com-
mitted credit lines, as well as most of our long-term debt obligations,
contain certain financial covenants. We are, and expect to remain,
in compliance within these covenants. No material debt instrument
contains provisions requiring acceleration of payment upon a debt
rating downgrade.
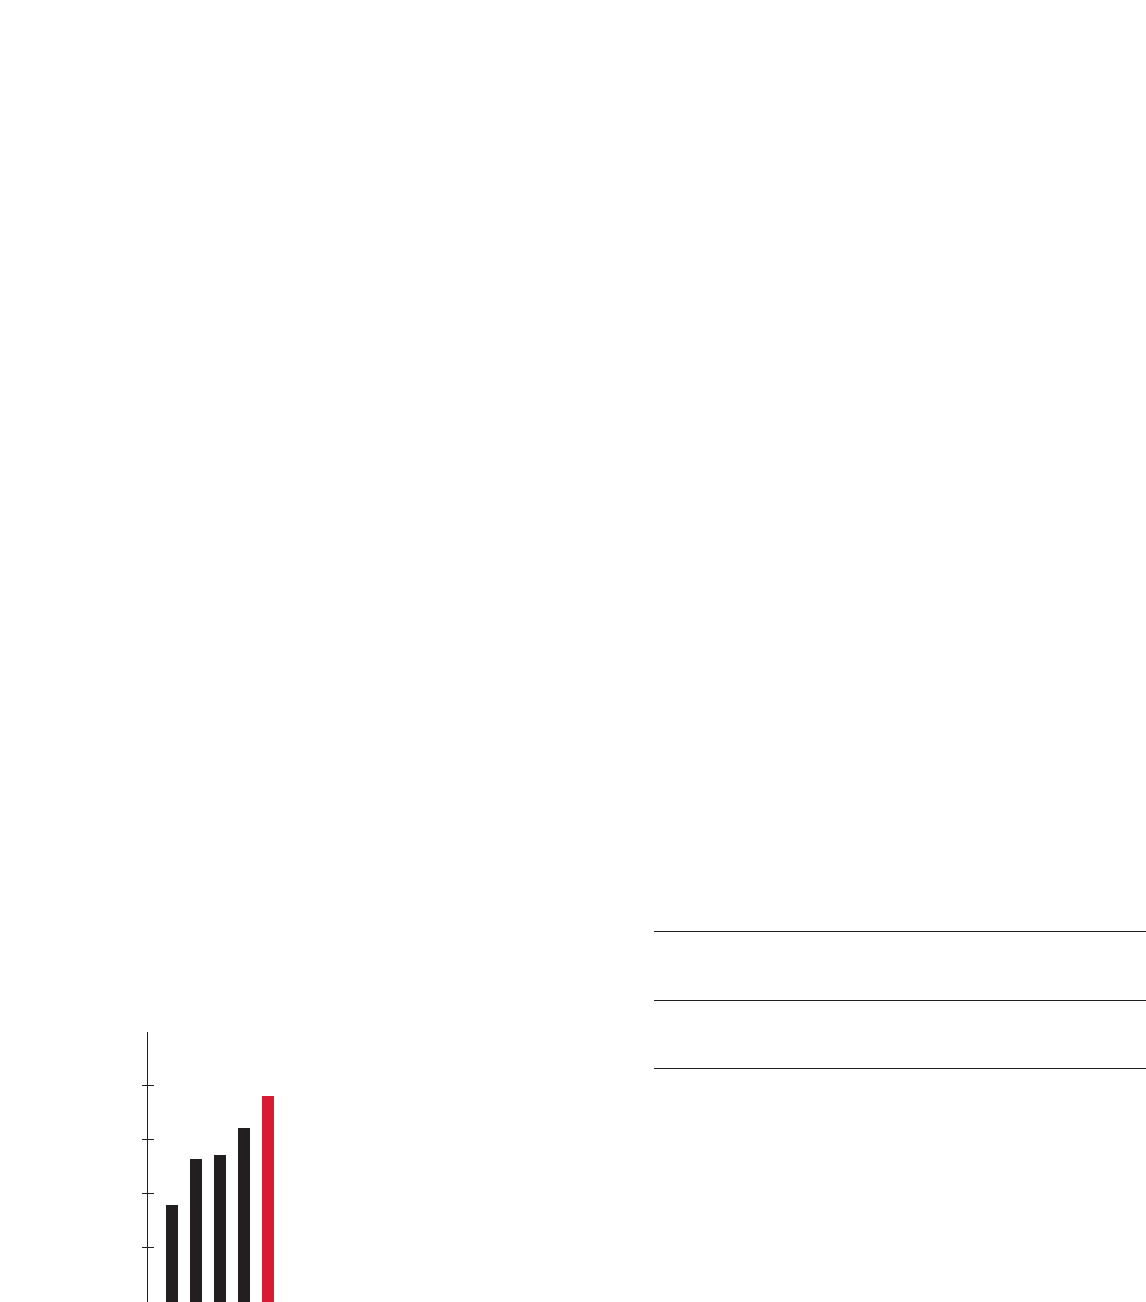
’00 ’01 ’02 ’03 ’04
$1,789
$2,657
$2,725
$3,213
$3,821
4,000
3,000
2,000
1,000
Cash Flow
from Operations
(millions)