Target 2004 Annual Report Download - page 33
Download and view the complete annual report
Please find page 33 of the 2004 Target annual report below. You can navigate through the pages in the report by either clicking on the pages listed below, or by using the keyword search tool below to find specific information within the annual report.-
 1
1 -
2
-
3
-
4
-
5
-
6
-
7
-
8
-
9
-
10
-
11
-
12
-
13
-
14
-
15
-
16
-
17
-
18
-
19
-
20
-
21
-
22
-
 23
23 -
 24
24 -
 25
25 -
 26
26 -
 27
27 -
 28
28 -
 29
29 -
 30
30 -
 31
31 -
 32
32 -
 33
33 -
 34
34 -
 35
35 -
 36
36 -
 37
37 -
 38
38 -
 39
39 -
 40
40 -
 41
41 -
 42
42 -
 43
43 -
44
 |
 |

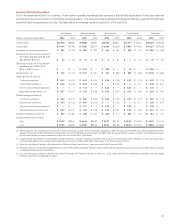
31
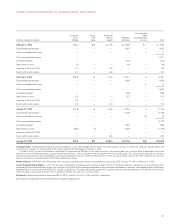
Leasehold
Acquisition
Goodwill Costs Other Total
(millions) 2004 2003 2004 2003 2004 2003 2004 2003
Gross asset $80 $80 $185 $182 $201 $200 $466 $462
Accumulated
amortization (20) (20) (52) (34) (188) (179) (260) (233)
Net goodwill
and intangible
assets $60 $60 $133 $148 $13 $21 $206 $229
As required, we adopted SFAS No. 142, “Goodwill and Other
Intangible Assets,” during the first quarter of 2002. In 2004, 2003 and
2002, the adoption of this statement reduced annual amortization
expense of certain intangible assets by approximately $5 million (less
than $.01 per share). The estimated aggregate amortization expense
of our definite-lived intangible assets for each of the five succeeding
fiscal years, 2005 to 2009, is expected to be $24 million, $22 million,
$20 million, $19 million and $19 million, respectively. During 2004,
goodwill with an approximate carrying value of $63 million was sold as
part of the Marshall Field’s transaction. There was no goodwill included
in the Mervyn’s sale transaction that also occurred in 2004.
Discounted cash flow models were used in determining fair value
for the purposes of the required annual goodwill impairment analysis.
No impairments were recorded in 2004, 2003 and 2002 as a result of
the tests performed.
Accounts Payable
Our accounting policy is to reduce accounts payable when checks
to vendors clear the bank from which they were drawn. Outstanding
checks included in accounts payable were $992 million and $966
million at year-end 2004 and 2003, respectively.
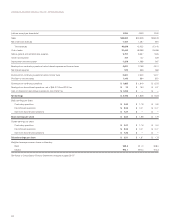
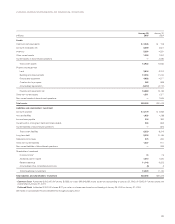
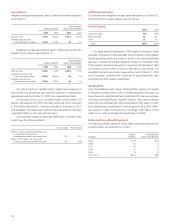
Accrued Liabilities
Accrued liabilities as of January 29, 2005 and January 31, 2004
consist of the following:
2004 2003
Wages and benefits $ 412 $ 369
Taxes payable 287 245
Gift card liability 214 169
Other 720 505
Tot al $1,633 $1,288
Taxes payable consist of real estate, employee withholdings and sales tax liabilities.
Gift card liability represents the amount of gift cards that have been issued but have
not been presented for redemption.
Commitments and Contingencies
At January 29, 2005, our obligations included notes and debentures
of $9,447 million (discussed in detail under Notes Payable and Long-
term Debt below), the present value of capital lease obligations
of $91 million and total future payments of operating leases with
total contractual lease payments of $3,049 million, including certain
options to extend the lease term that are expected to be exercised
in the amount of $1,415 million (discussed in detail under Leases on
page 32). In addition, commitments for the purchase, construction,
lease or remodeling of real estate, facilities and equipment were
approximately $544 million at year-end 2004. Merchandise royalty
commitments of approximately $102 million are due during the five-
year period ending in 2009. Throughout the year, we enter into various
commitments to purchase inventory. In addition to the accounts
payable reflected in our Consolidated Statements of Financial Position
on page 25, we had commitments with various vendors for the
purchase of inventory as of January 29, 2005. These purchase com-
mitments are cancelable by their terms.
We expect to receive a share of the proceeds from the $3 billion
Visa/MasterCard antitrust litigation settlement, as we are a member of
the class action lawsuit. However, the amount and timing of the pay-
ment are not certain at this time.
We are exposed to claims and litigation arising out of the ordinary
course of business and use various methods to resolve these matters
in a manner that we believe serves the best interest of our shareholders
and other constituents. Our policy is to disclose pending lawsuits and
other known claims that we expect may have a material impact on
our results of operations, cash flows or financial condition. Other than
the matter discussed above, we do not believe any of the currently
identified claims and litigated matters meet this criterion, either
individually or in the aggregate.
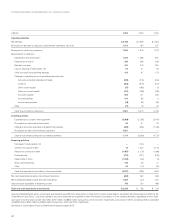
Notes Payable and Long-term Debt
At January 29, 2005, no notes payable were outstanding. The average
amount of notes payable outstanding during 2004 was $55 million at
a weighted average interest rate of 1.3 percent. In 2004, notes payable
balances fluctuated significantly during the year due to seasonal
financing needs, proceeds from sale of Marshall Field’s and Mervyn’s
and other factors. On July 28, 2004, our short-term borrowing reached
$1,422 million, its highest level for the year.
At January 31, 2004, no notes payable were outstanding. The
average amount of notes payable outstanding during 2003 was
$377 million at a weighted average interest rate of 1.2 percent. On
October 31, 2003, our short-term borrowing reached $1,409 million,
its highest level for the year.
At January 29, 2005, two committed credit agreements totaling
$1,600 million were in place through a group of 25 banks at specified
rates. Of these credit lines, an $800 million credit facility expires in
June 2005 and includes a one-year term-out option to June 2006.
The remaining $800 million credit facility expires in June 2008. There
were no balances outstanding at any time during 2004 or 2003 under
these agreements.
In 2004, we issued no long-term debt. We called or repurchased
$542 million of long-term debt with an average remaining life of 24
years and a weighted average interest rate of 7.0 percent, resulting in
a pre-tax loss of $89 million (approximately $.06 per share), reflected
in interest expense.
In 2003, we issued $500 million of long-term debt maturing in
2008 at 3.38 percent, $200 million of long-term debt maturing in 2018
at 4.88 percent and $500 million of long-term debt maturing in 2013
at 4.00 percent. We also called or repurchased $297 million of long-
term debt with an average remaining life of 20 years and a weighted
average interest rate of 7.8 percent, resulting in a pre-tax loss of $15
million (approximately $.01 per share), reflected in interest expense.
The portion of long-term debt secured by credit card receivables
was $750 million at January 29, 2005. On January 31, 2004, we had
$1,500 million of long-term debt secured by credit card receivables,
$750 million of which was classified as current portion of long-term debt.